

Companies • Products • Clinics • Capital •
Laboratories • Research • Clinical Trials • Policy
Authors: Teddy Hoppe1, George Kenefati2, Gelana Tostaeva3, Ana Radanovic4, Daniel Hașegan5, Paul Brezovsky III6, Fargol Yeganeh Fathi4,7, Nayanika Biswas8, Saar Lively9, Louis Zhao10,11, Margot Hanley12,13, and Charles Rodenkirch14
Affiliations: 1Nathan Kline Institute; 2NYU Langone Health; 3Icahn School of Medicine at Mount Sinai; 4Weill Cornell Medicine; 5NYU Grossman School of Medicine; 6Qapita; 7Burke Neurological Institute; 8Barclays; 9Sero Labs; 10Radical Health; 11Columbia University; 12Netholabs; 13Cognitive Futures Lab, Duke University; 14Sharper Sense
All authors are members of the NeuroNYC team. This report is an independent NeuroNYC publication. Affiliations are provided for identification only; the authors’ employers and affiliated institutions did not necessarily sponsor, review, or endorse the report.
01
NeuroNYC Resources
Greater New York is home to a world-class neurotechnology ecosystem. Our tracker catalogs regional companies, clinics, laboratories, and investors.
Explore events that connect the regional neurotechnology community and foster collaboration, communication, and shared learning.
Follow recent neurotechnology news from across Greater New York.
Latest Neurotech Papers
Track recent neurotechnology publications from researchers across the region.
Local Neurotech Jobs
Find neurotechnology roles at regional companies, laboratories, health systems, and partner organizations.
Local Neurotech Products
Explore neurotechnology products developed or commercialized by organizations in Greater New York.
Local Neurotech Clinical Trials
Review registered neurotechnology studies associated with regional institutions and investigators.
Join NeuroNYC
Join the Community
Sign up to access our Slack channel and free events.
Volunteer
Join the team and get priority access.
Donate
Help us advance neurotechnology and unlock its benefits for the Greater New York region.
Purpose and methodology
Purpose. NeuroNYC prepared this report to describe the scale, composition, activity, and development needs of the Greater New York neurotechnology ecosystem. It consolidates public information on companies, clinical programs, laboratories, funders, publications, clinical trials, policy, and selected ecosystem relationships. The report is descriptive rather than a census, market-sizing study, investment-performance analysis, or comparative ranking of regions.
Geographic scope and data cutoff. “Greater New York” includes New York City, Long Island, Westchester and the lower Hudson Valley, northern and central New Jersey, Princeton, southwestern Connecticut, and New Haven. Unless a figure states otherwise, the reporting period covers activity identified through July 2026.
Inclusion and exclusion. An organization or program was included when it was active at the cutoff date, had a documented operational, research, clinical, investment, or organizational presence in the region, and worked directly in neurotechnology. The scope includes brain–computer interfaces, neuroprostheses, neuroimaging, neurofeedback, neuromodulation, neuroinformatics, neural sensing and electrophysiology, rehabilitation technologies, and closely related computational or clinical platforms. Entities with no verified regional presence, inactive or discontinued entities, general neuroscience activity without a material technology component, and organizations supported only by undated or unverifiable claims were excluded.
Evidence and interpretation. Counts are based on the companies, programs, laboratories, funders, publications, and trials included in the analysis, not on a claim of complete regional coverage. Categories can overlap because a single entity may span multiple technologies, indications, markets, or functions. Public sources favor organizations that disclose activity and therefore underrepresent private, early-stage, discontinued, or confidential work. Financing mandates do not establish deployed capital; regulatory or trial status does not establish commercialization, reimbursement, utilization, or clinical impact. Findings are separated from proposed economic-development interventions in the conclusion.
02
Executive summary
Central thesis
Greater NY is not converging on a single winning modality. It is becoming a systems market where sensing, stimulation, imaging, AI, clinical workflow, and longitudinal data are bundled around specific use cases.
The bottleneck is shifting from invention toward execution: evidence generation, multicenter operations, reimbursement, manufacturing, and deployment architecture.
Scale, institutional depth, and the regional path from discovery to deployment

Figure 1. Core ecosystem counts and geographic scope.
Greater New York comprises New York City, Long Island, Westchester and the lower Hudson Valley, northern and central New Jersey, Princeton, southwestern Connecticut, and New Haven. The mapped ecosystem is large enough to support a regional economic-development strategy, but the central challenge is conversion: moving scientific and clinical capability into validated products, durable companies, specialized jobs, and locally retained production.
Scale and composition. The analysis maps 39 companies, 47 clinical programs, 59 laboratories, and 48 funder organizations across the region. The breadth is economically relevant because it creates multiple entry points for company formation, clinical adoption, investment, and specialized services.
Institutional and research concentration. Thirty-eight of the 59 laboratories are classified as clinical or translational, and the regional cohort produced 960 query-defined neurotechnology publications in 2025. The principal opportunity is to connect this research base more consistently to product development and commercialization.
Commercial maturity and financing. The company base spans active commercial operations, development-stage ventures, and organizations in transition, while disclosed financing is concentrated in a limited number of large transactions.
Clinical translation and access. The 47 clinical programs provide an established base of clinical-trial activity and care across academic, independent, rehabilitation, and virtual-first settings, but only eight explicitly identify an at-home, remote, virtual, telerehabilitation, or home-rental pathway. Product authorization, reimbursement, workflow integration, and patient access remain separate constraints.
Constraints on regional scale-up. The evidence points to gaps in translational infrastructure, pilot and procurement pathways, shared clinical validation, specialized manufacturing, founder-investor connectivity, workforce development, regulatory and reimbursement support, and neural-data governance. These are candidate intervention areas rather than effects directly measured by the dataset.

Figure 2. Neurotechnology publications in 2025 and cumulative clinical-trial counts.
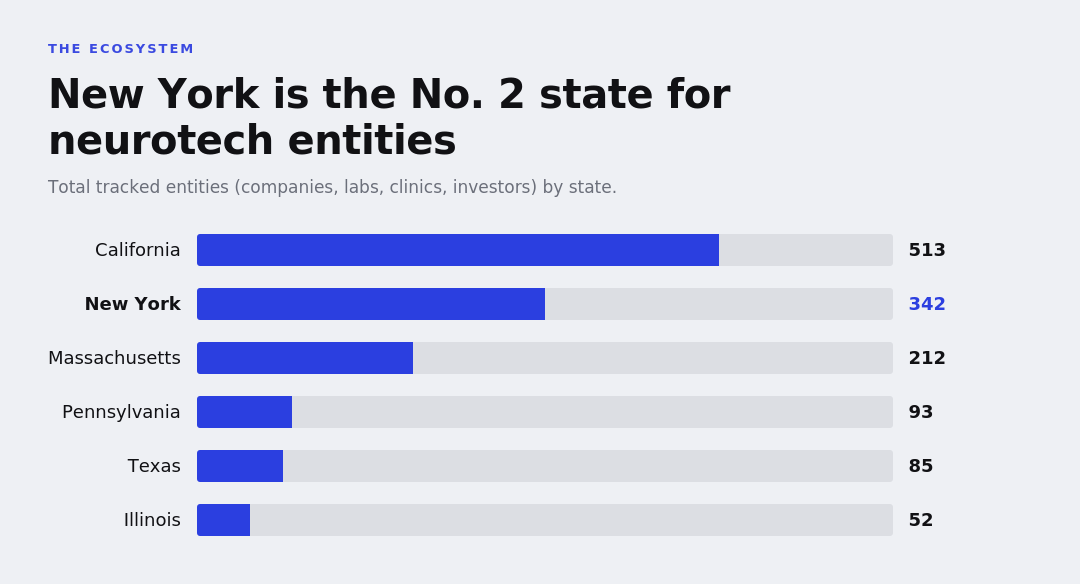
Figure 3. State rankings by number of neurotechnology entities.
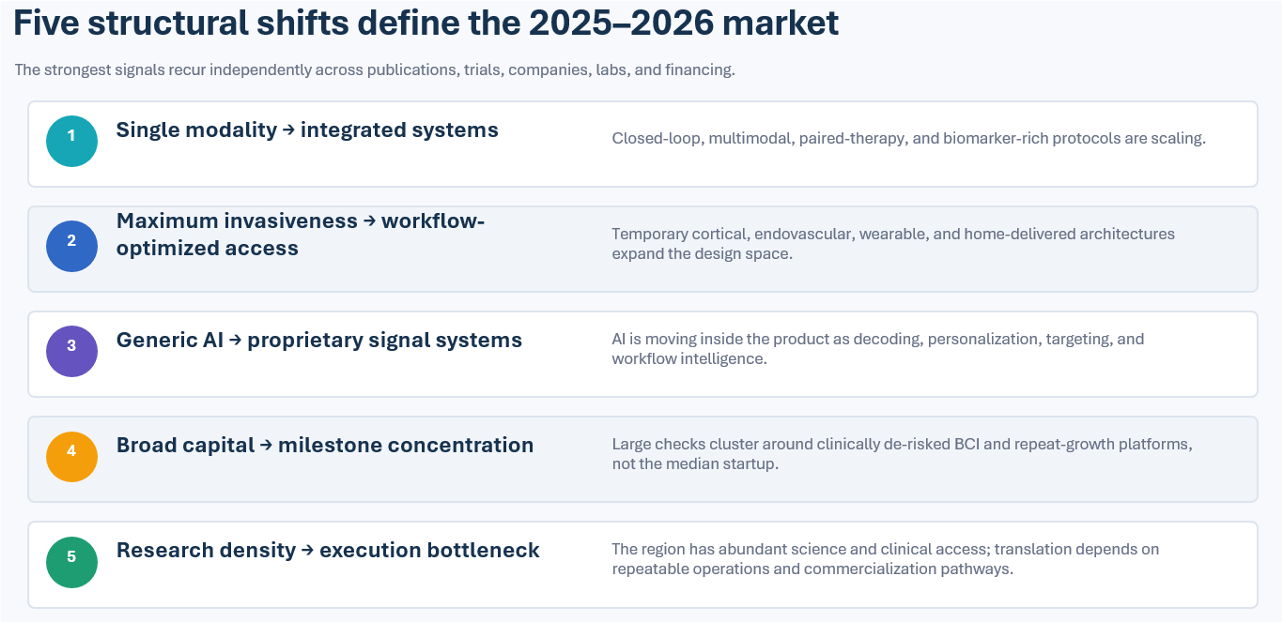
Figure 4. Structural shifts in the regional neurotechnology market.
03
NeuroNYC community
Community metrics as of July 2026
LinkedIn Followers: 3,774
Email List Subscribers: 1,393
Slack Channel Members: 476
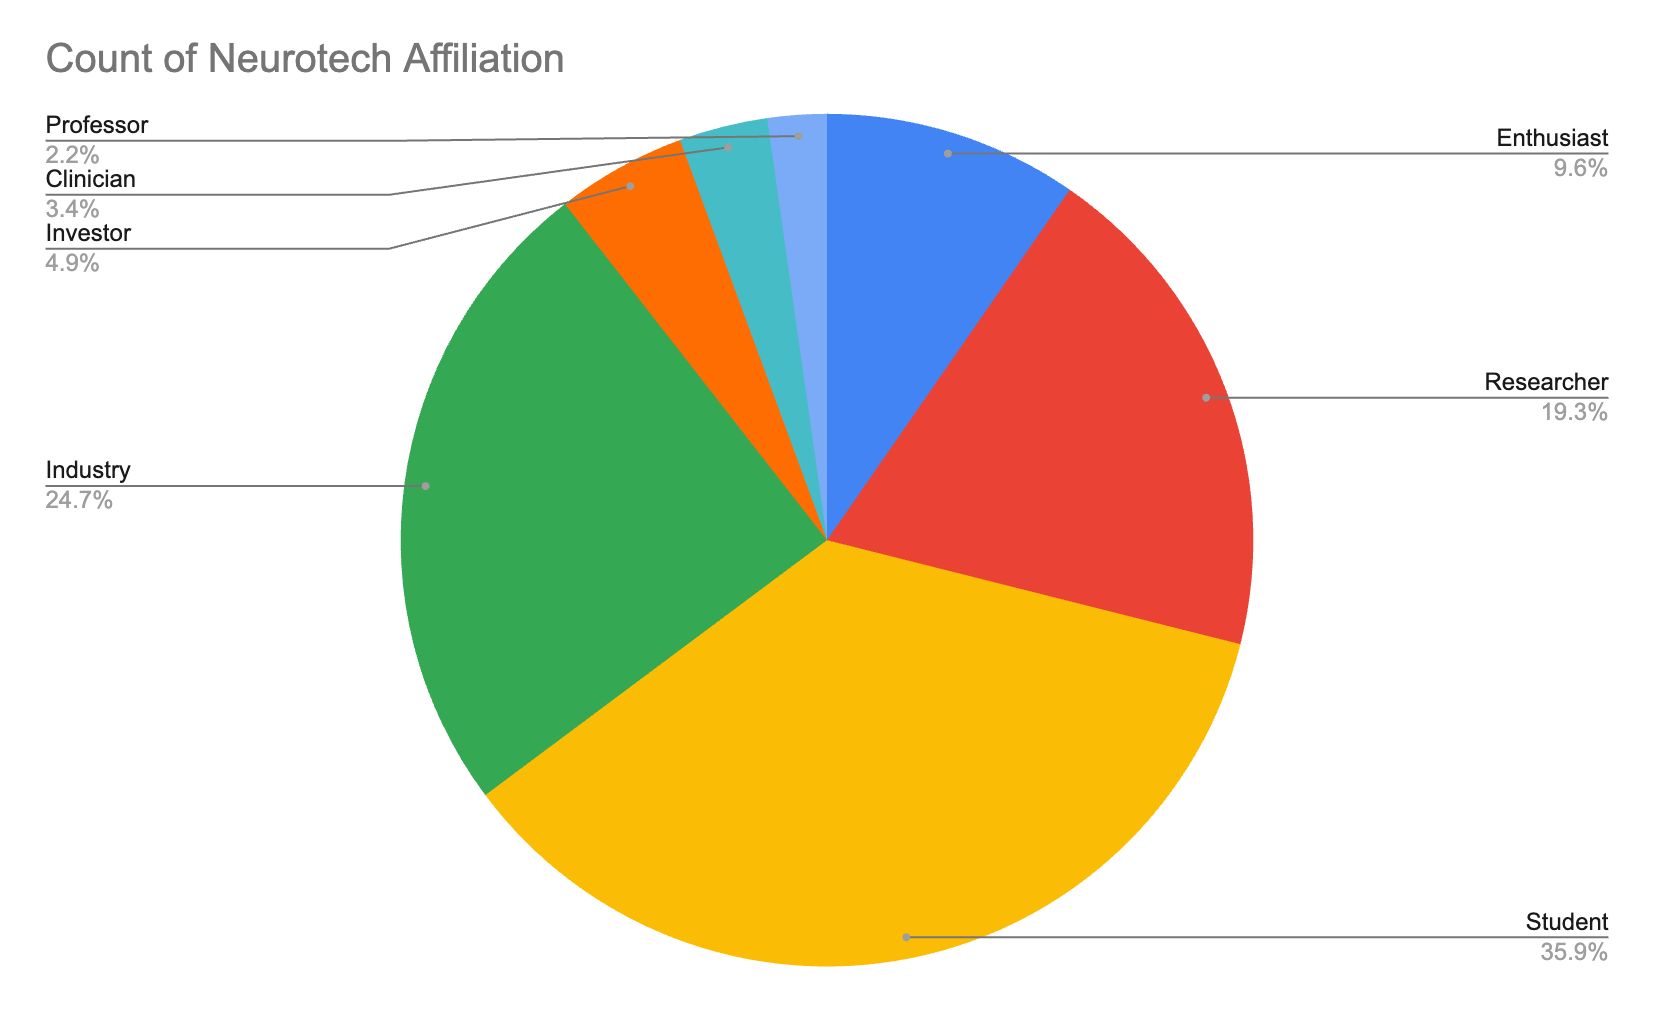
Mailing List Affiliation Breakdown
04
Companies: operating status and maturity
Public evidence distinguishes active commercial operation from development, transition, and unresolved status.
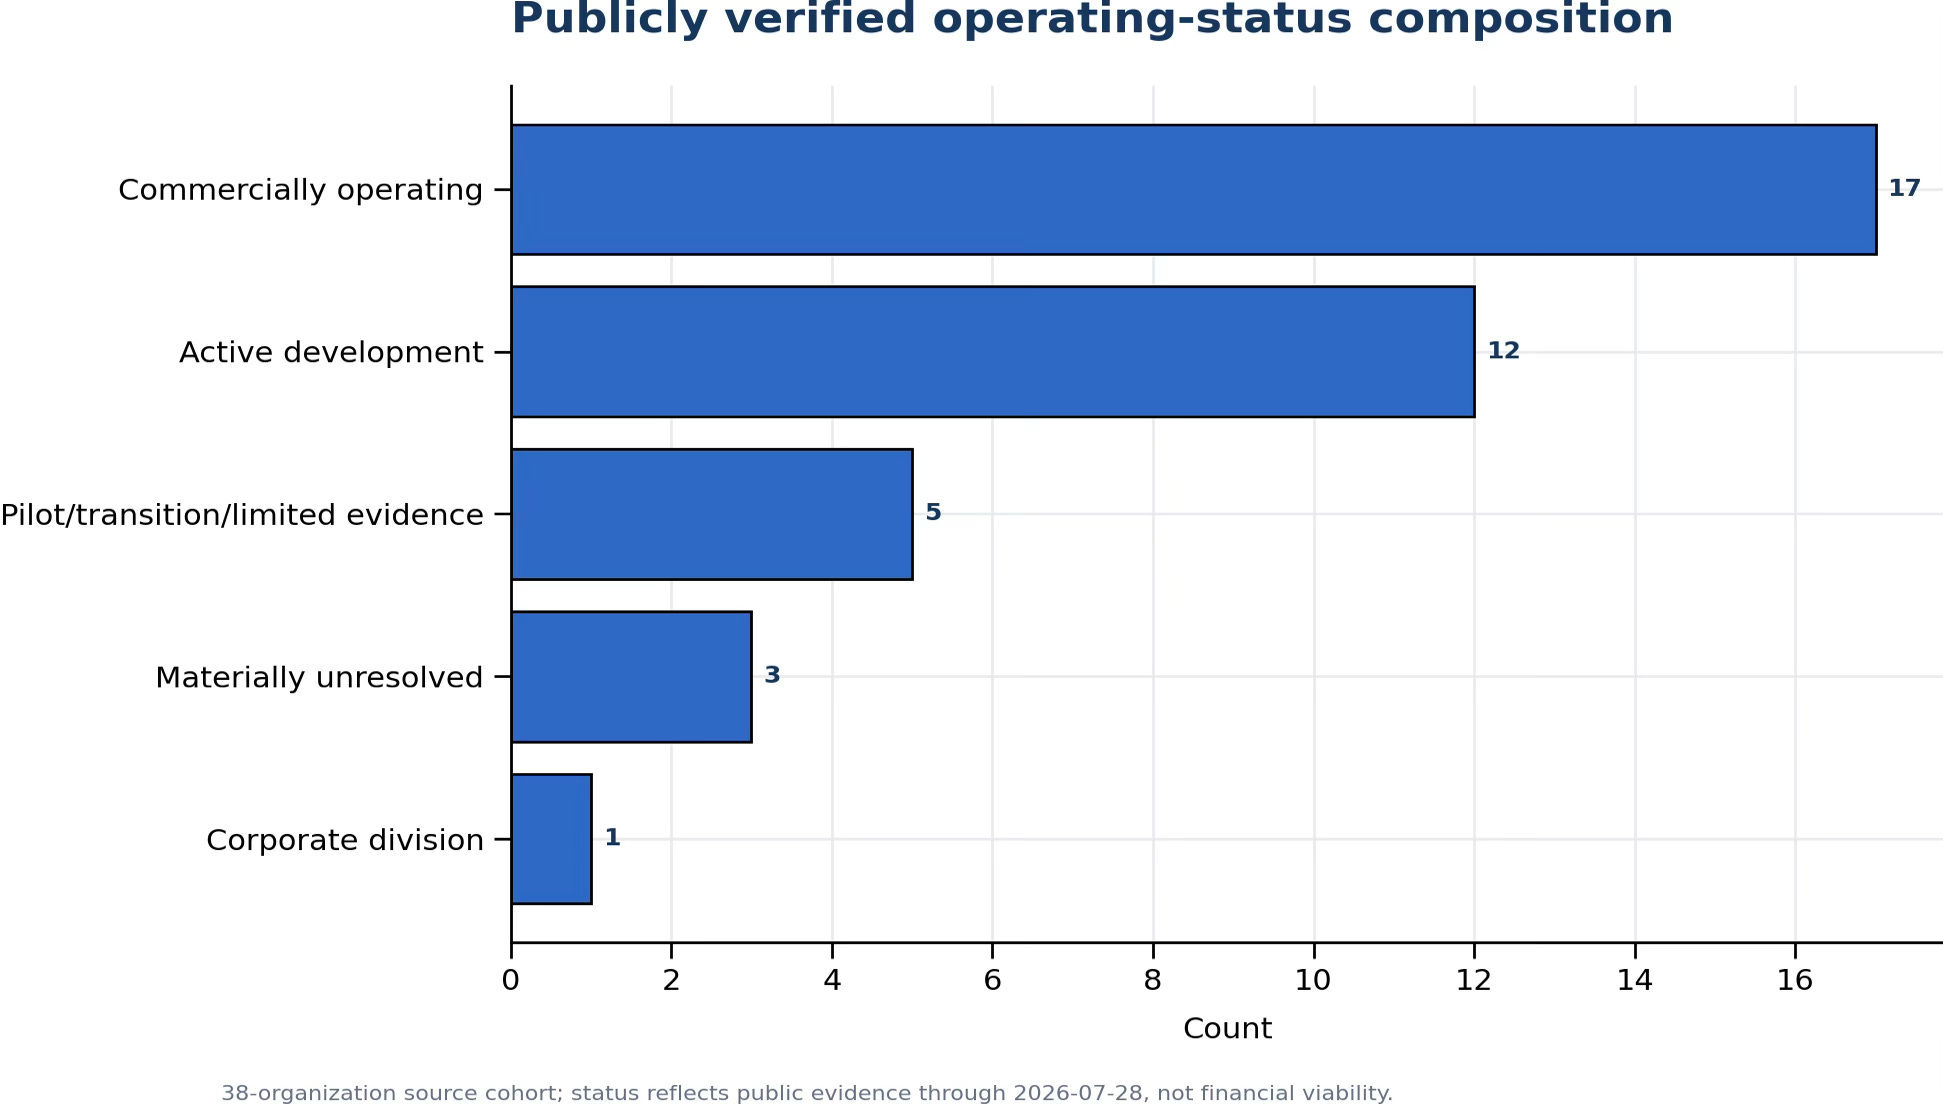
Figure 5. Publicly verified operating-status composition of the 38 companies included in this analysis.
Regulatory status is product- and indication-specific. Breakthrough Device designation, investigational device exemption activity, trial registration, hospital use, and “clinical-grade” claims do not constitute marketing authorization. Likewise, authorization alone does not establish commercial launch, reimbursement, clinical adoption, or approval across an entire product portfolio.
05
Companies: technology and market composition
The company cohort is clinically weighted and technologically heterogeneous.
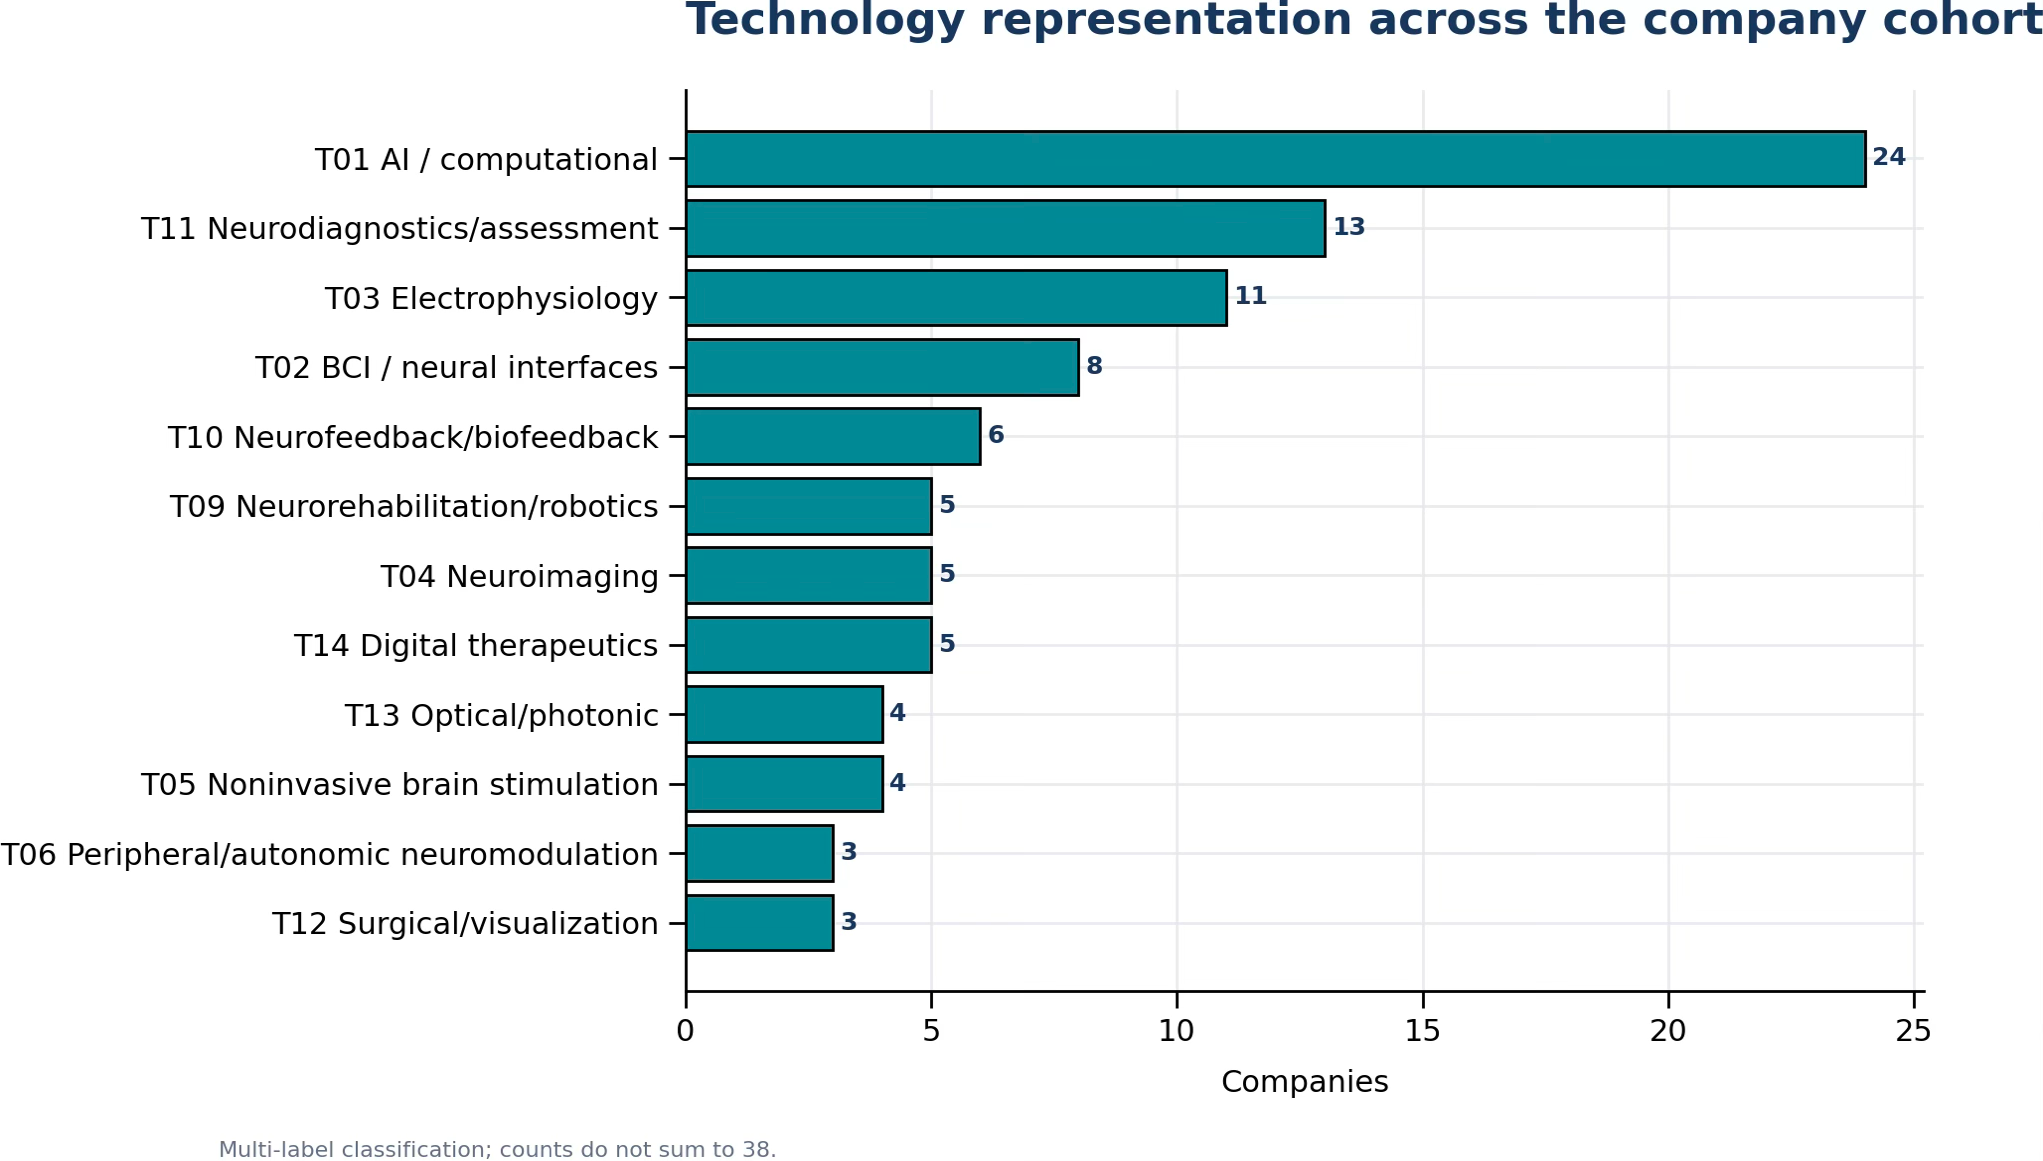
Figure 6A. Technology representation within the company cohort.
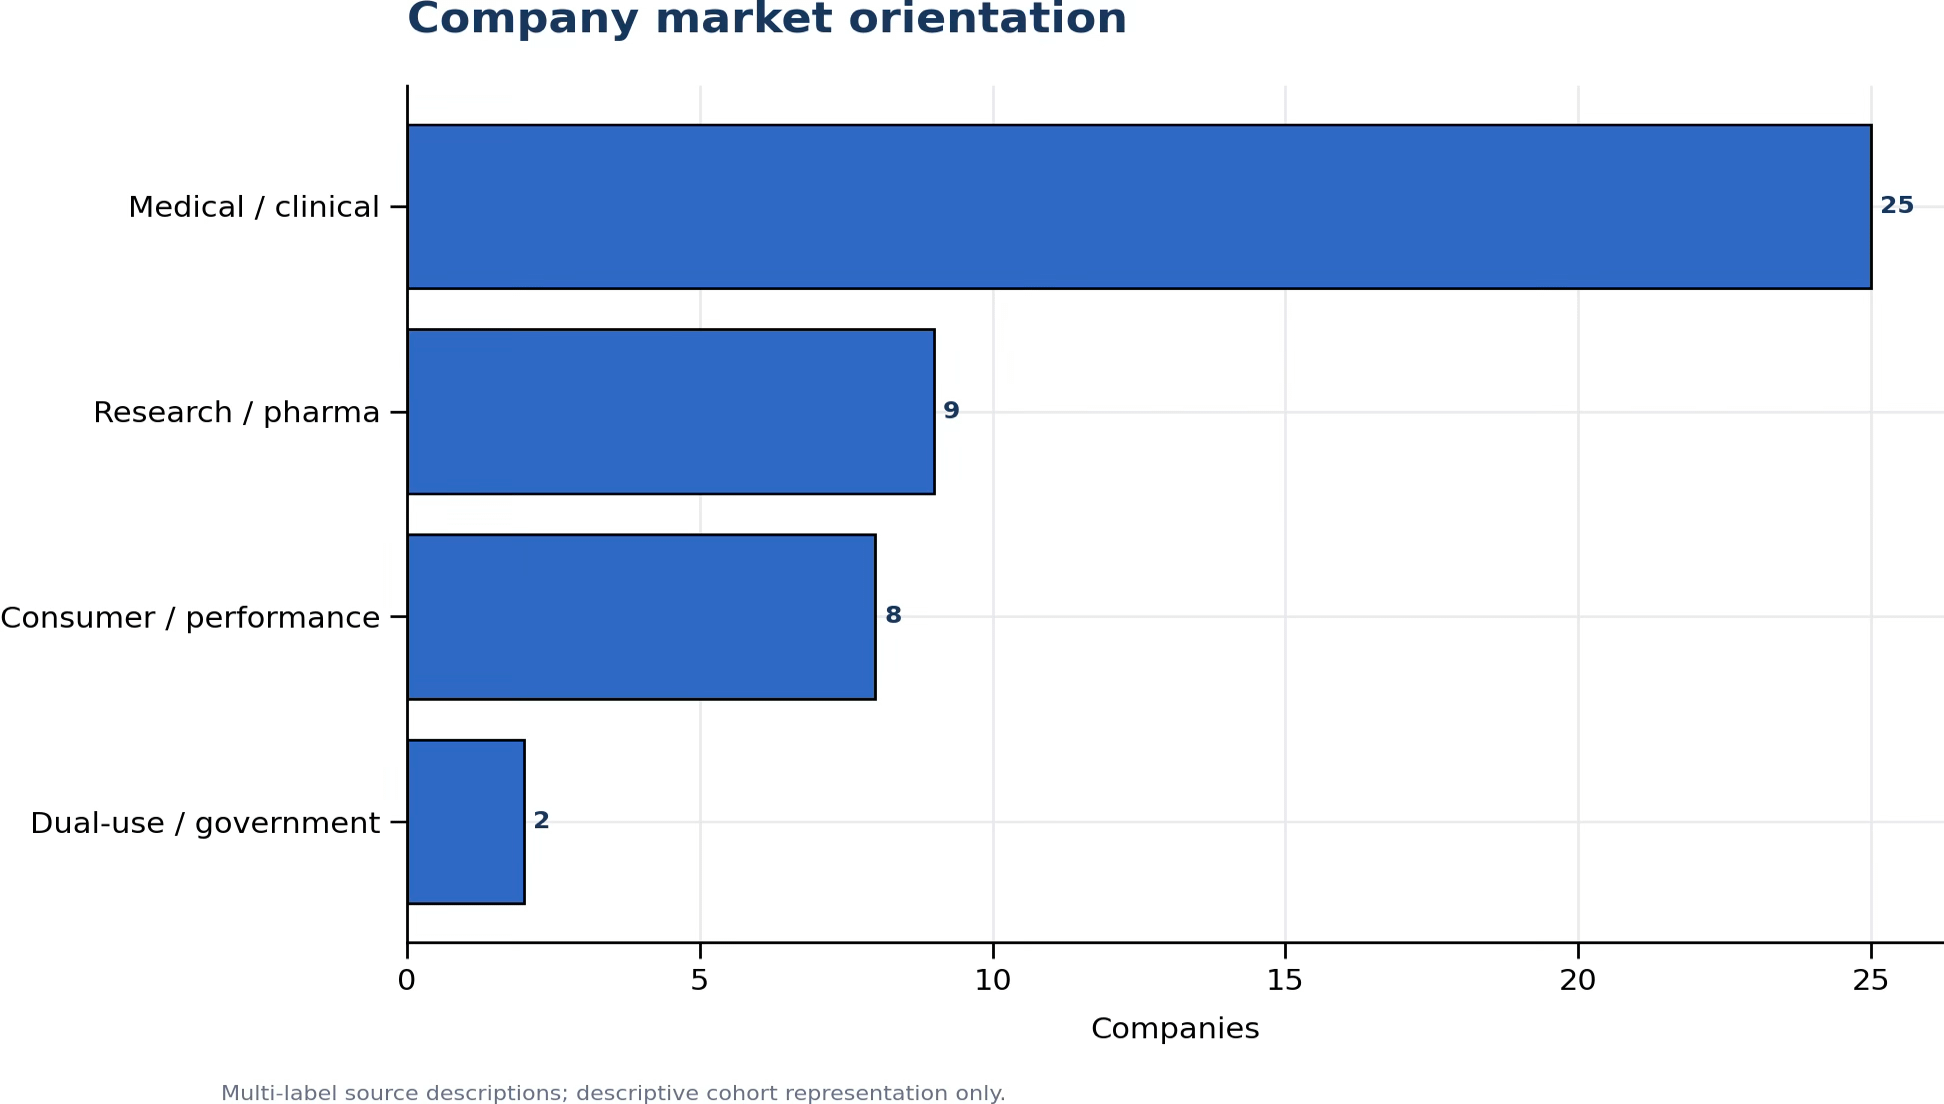
Figure 6B. Market orientation within the company cohort.
AI and computational methods, diagnostics, electrophysiology, neural interfaces, neurofeedback, imaging, stimulation, rehabilitation, and digital interventions all appear in the company cohort. Medical and clinical applications constitute the largest market orientation, with research and pharmaceutical uses and consumer and performance applications forming meaningful secondary segments. Category assignments reflect public company positioning and may overlap.
06
Companies: architecture, function and indication
The regional product landscape spans sensing, interpretation, intervention, and assistance rather than one dominant device class.
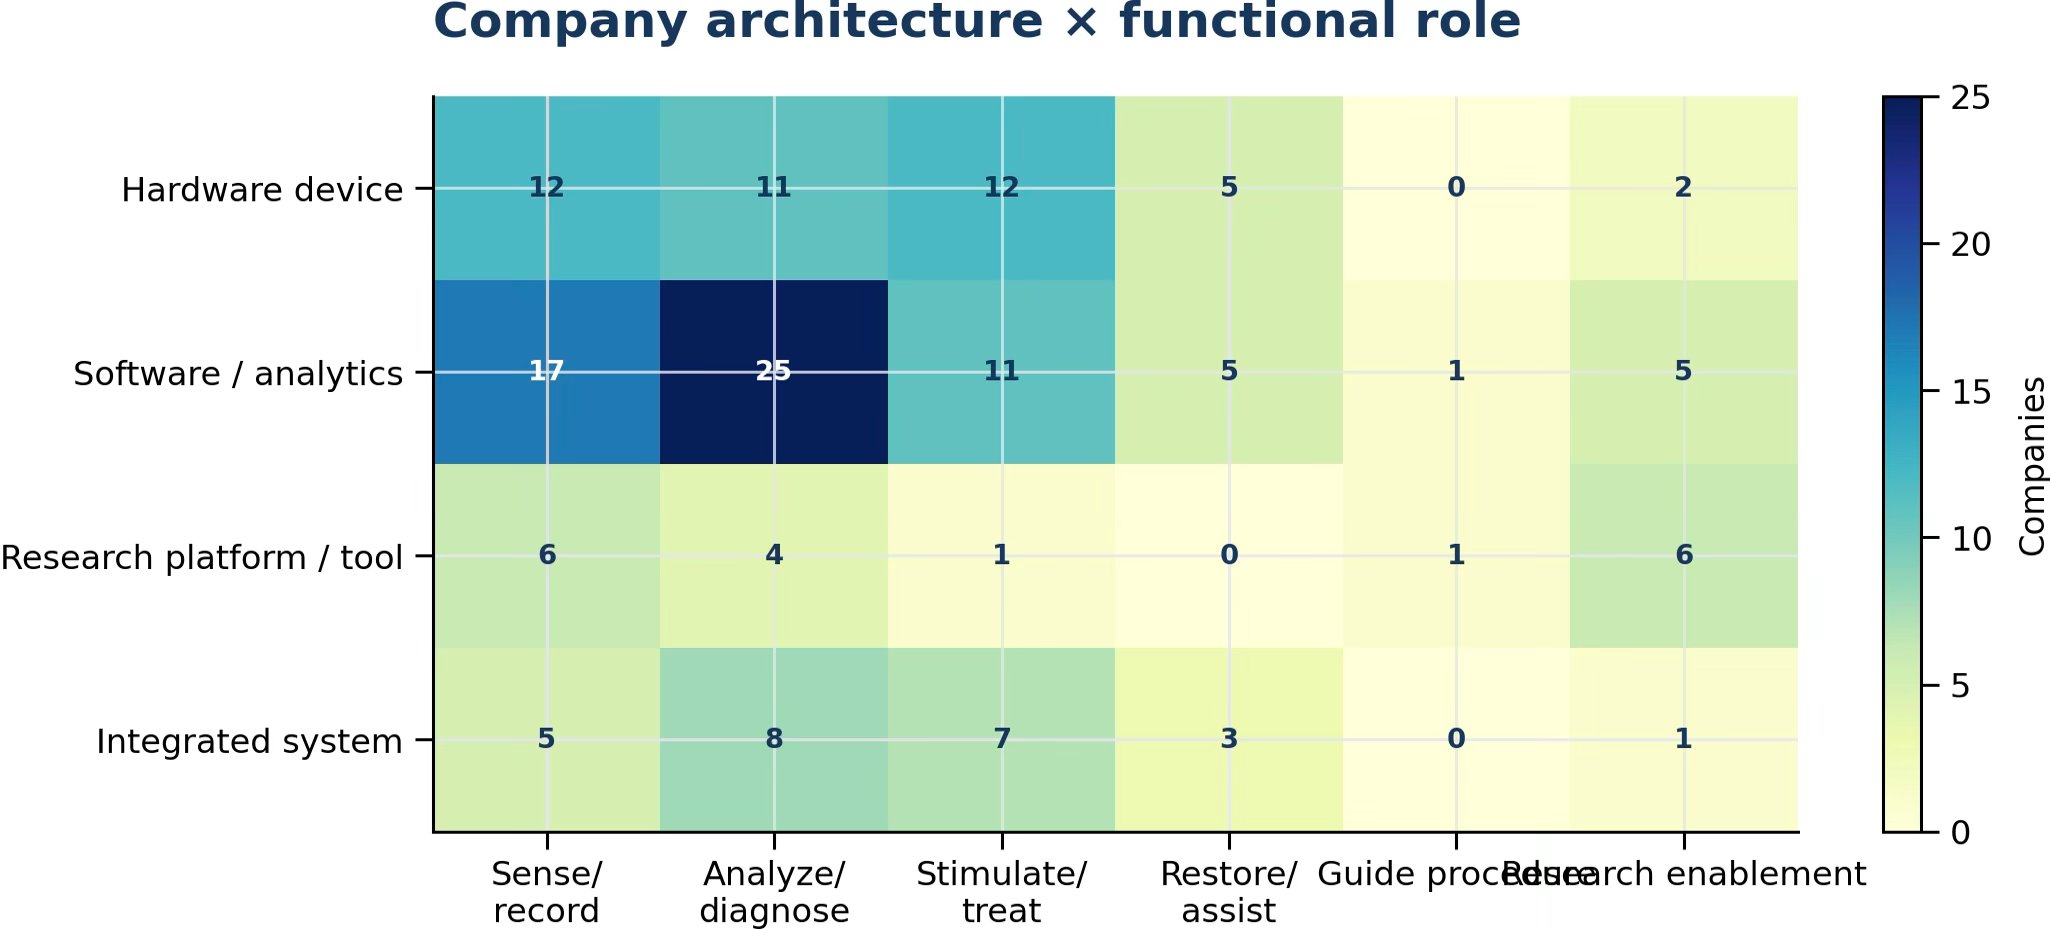
Figure 7A. Company architecture by functional role.
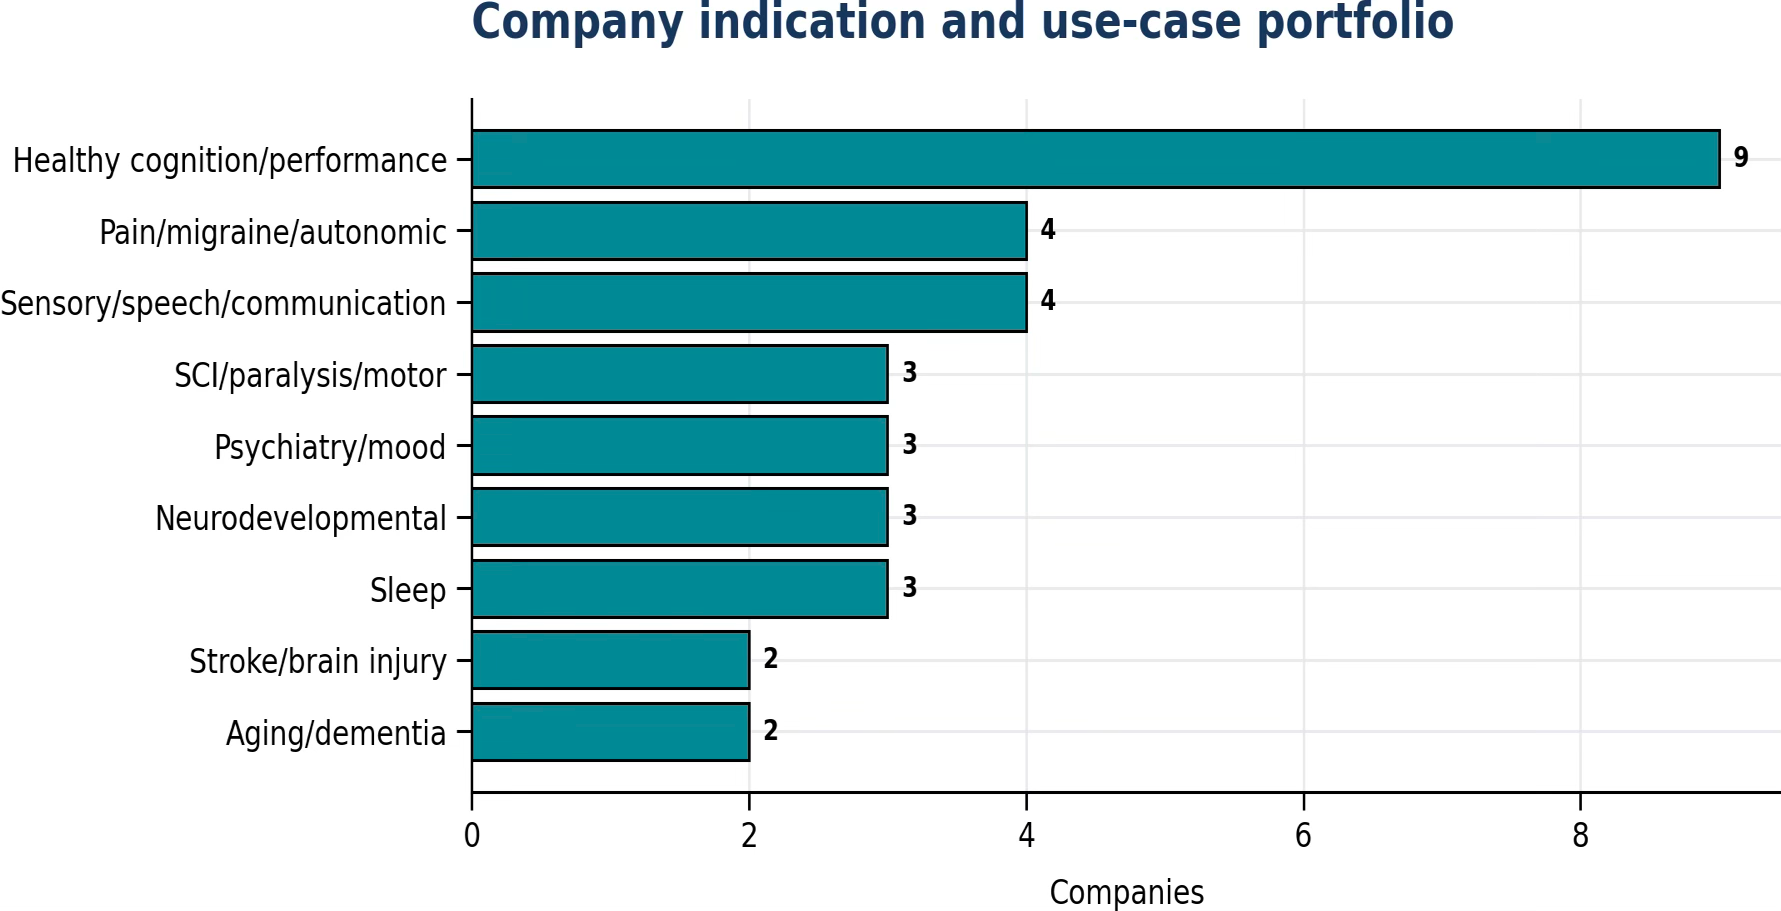
Figure 7B. Company representation by indication and use case.
The portfolio contains hardware, software, research tools, and integrated systems. Sensing and analysis frequently co-occur, while intervention, restoration, and procedural guidance occupy smaller but distinct segments. Condition tags reflect stated positioning, not epidemiology, demand, or revenue.
07
Companies: selected 2025–2026 milestones
Clinical, financing, regulatory, and organizational developments through July 2026
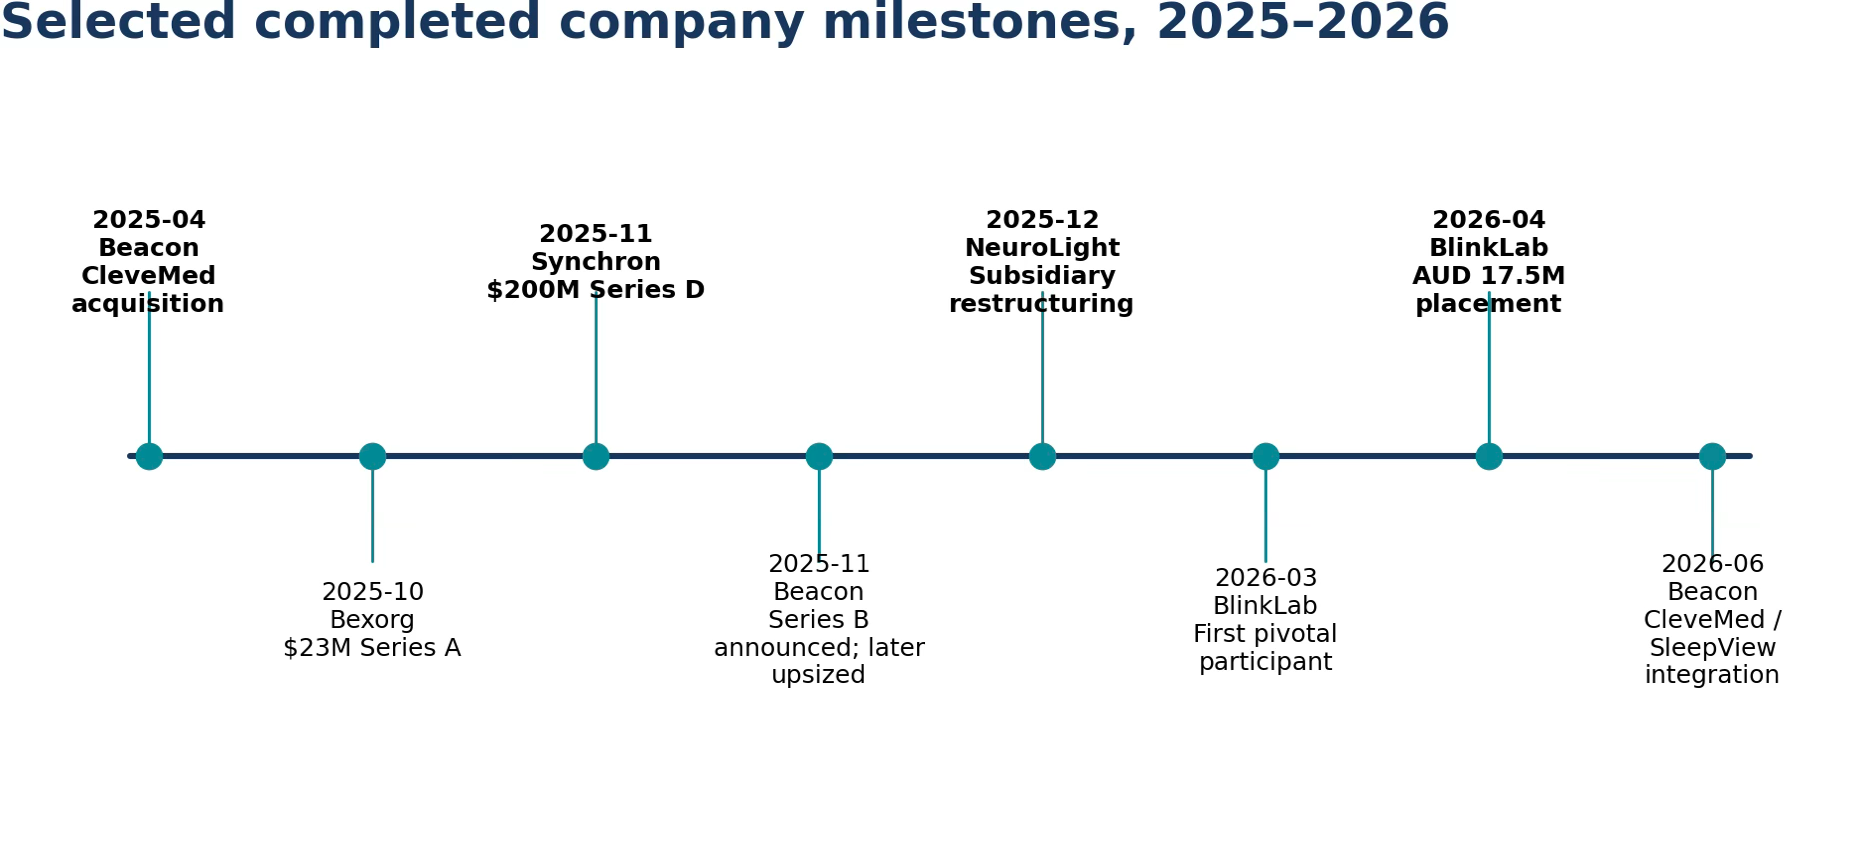
Figure 8. Selected completed and dated company milestones through July 28, 2026.
08
Clinical programs: modality and provider structure
Listed care spans academic health systems, independent practices, rehabilitation, and virtual-first models.
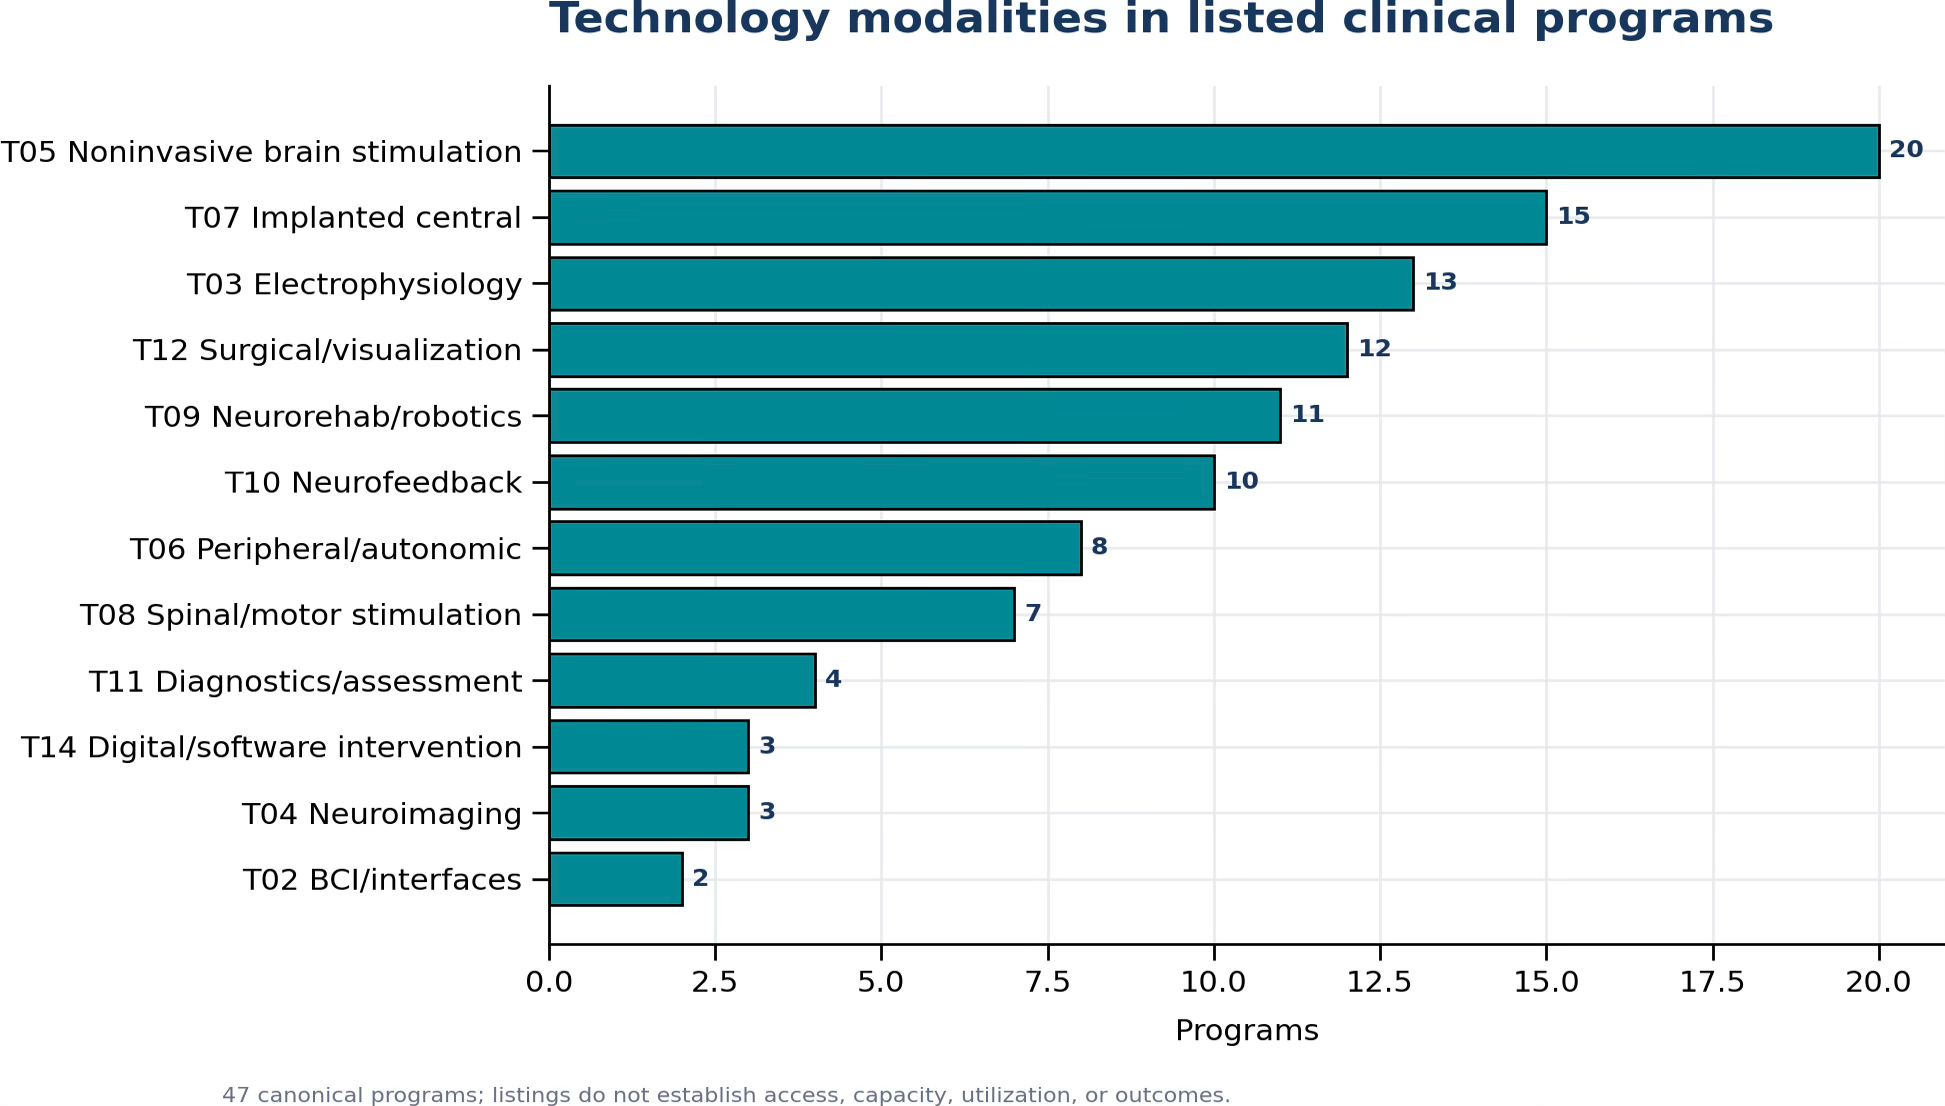
Figure 9A. Technology modalities represented across 47 listed clinical programs.
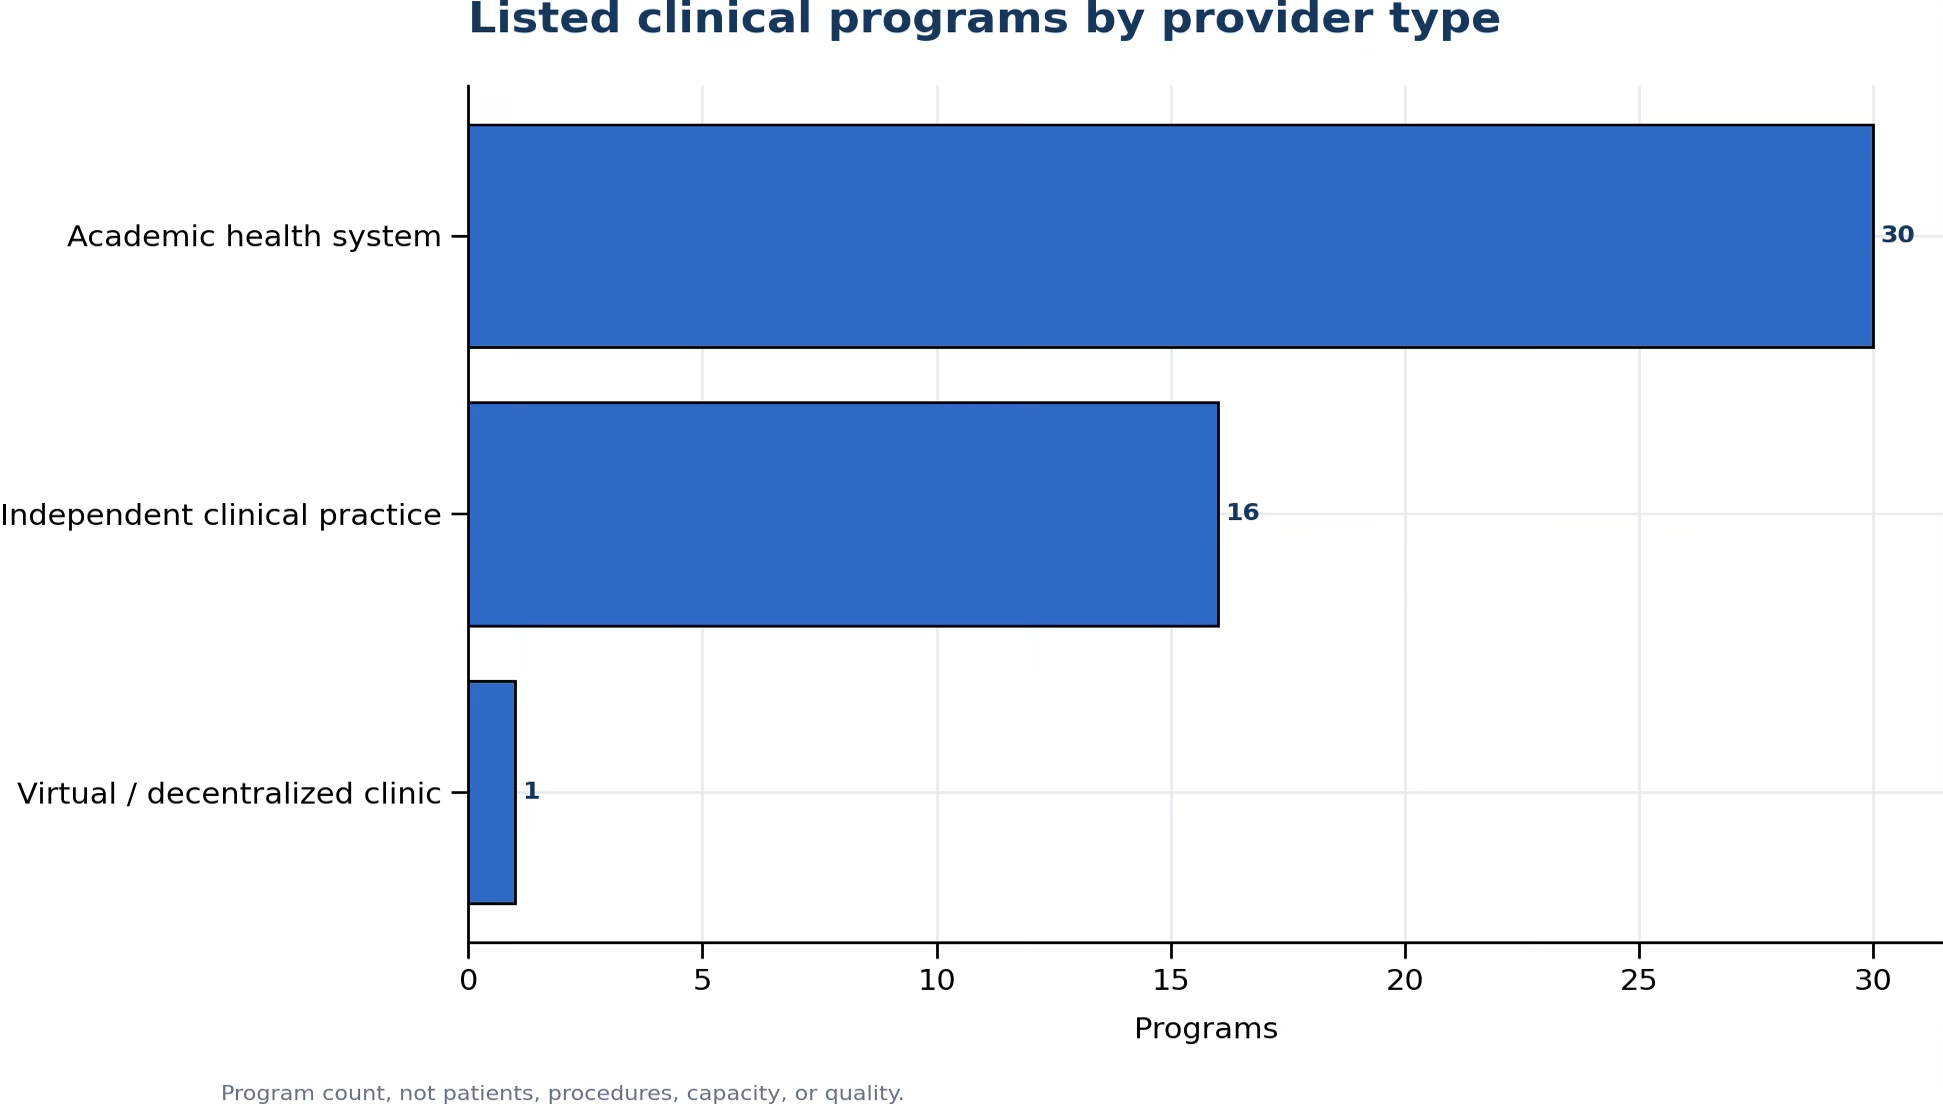
Figure 9B. Listed clinical programs by provider type.
Academic health systems dominate invasive, surgical, imaging, epilepsy, movement-disorder, and complex rehabilitation modalities. Independent practices are more visible in outpatient TMS, neurofeedback, psychiatric care, and selected remote services. Counts describe programs, not clinicians, procedures, patients, capacity or quality.
09
Clinical programs: condition × modality
Different indications engage distinct technology portfolios and care settings.
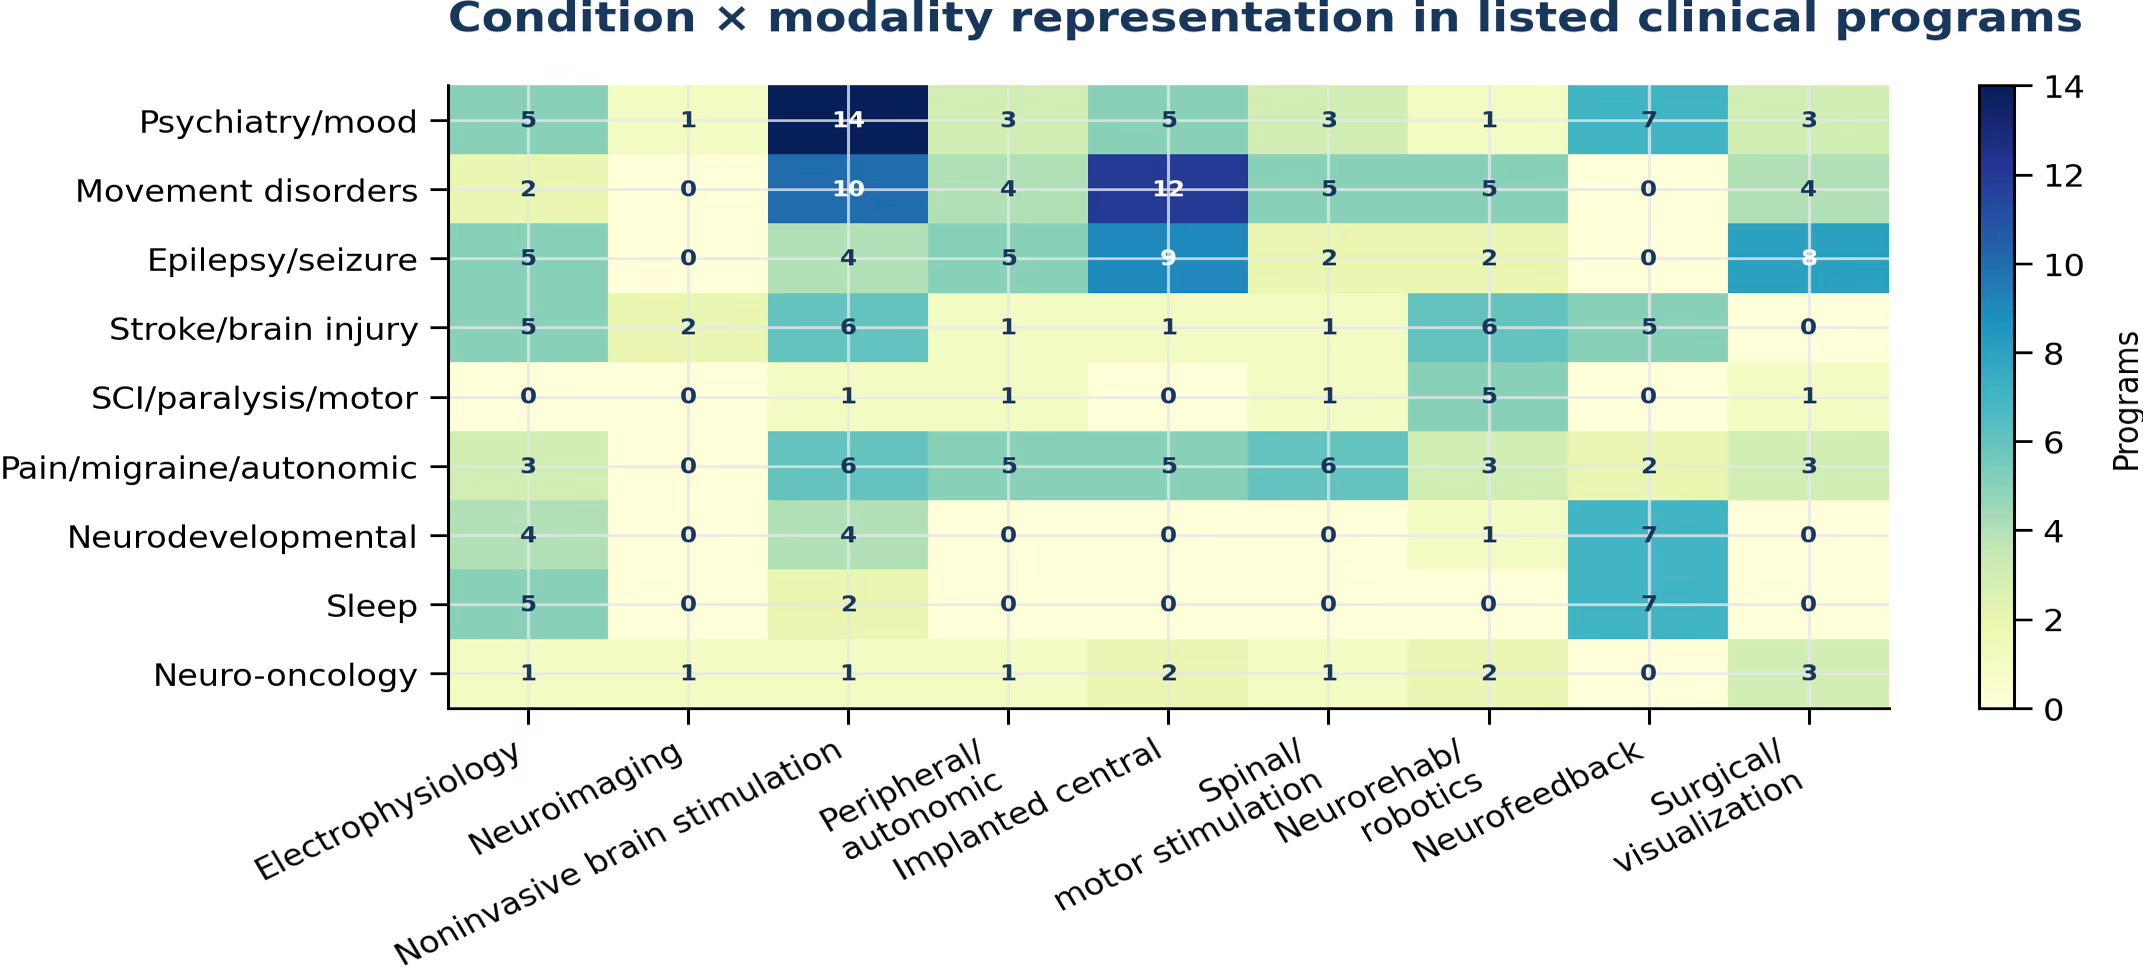
Figure 10A. Condition-by-modality representation among the clinical programs included in the analysis.
Psychiatric conditions, movement disorders, epilepsy, pain, and stroke/brain injury show broad listed modality representation. Implantable and surgical systems cluster in academic programs; neurofeedback and outpatient noninvasive stimulation are more widely represented among independent providers.
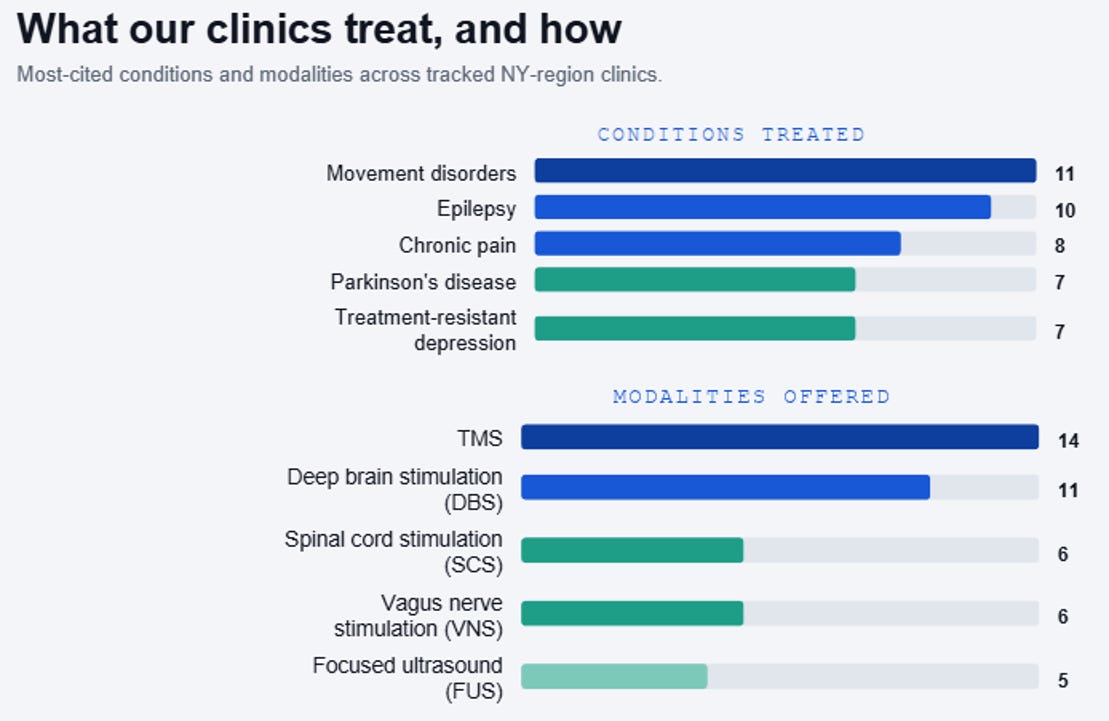
Figure 10B. Most frequently listed neurotechnology treatments and conditions in Greater New York.
10
Clinical access: remote delivery and reimbursement
A listed technology becomes accessible only after multiple product, coverage, and workflow gates are passed.
Figure 11. Modality-level reimbursement architecture.
Eight of 47 listed programs explicitly mention at-home, remote, virtual, telerehabilitation or home-rental delivery.
Mature procedural categories—including spinal cord stimulation and selected uses of deep brain stimulation, transcranial magnetic stimulation, electroencephalography, and focused ultrasound—have comparatively well-defined reimbursement pathways. External vagus nerve stimulation, prescription digital therapeutics, nonstandard stimulation protocols, wellness products, and investigational brain–computer interfaces remain fragmented, product-specific, or restricted to research settings. Coverage ultimately varies by product, indication, payer, billing code, documentation, and provider.
11
Capital: mandates and observed deployment
What public data reveal—and do not reveal—about regional capital
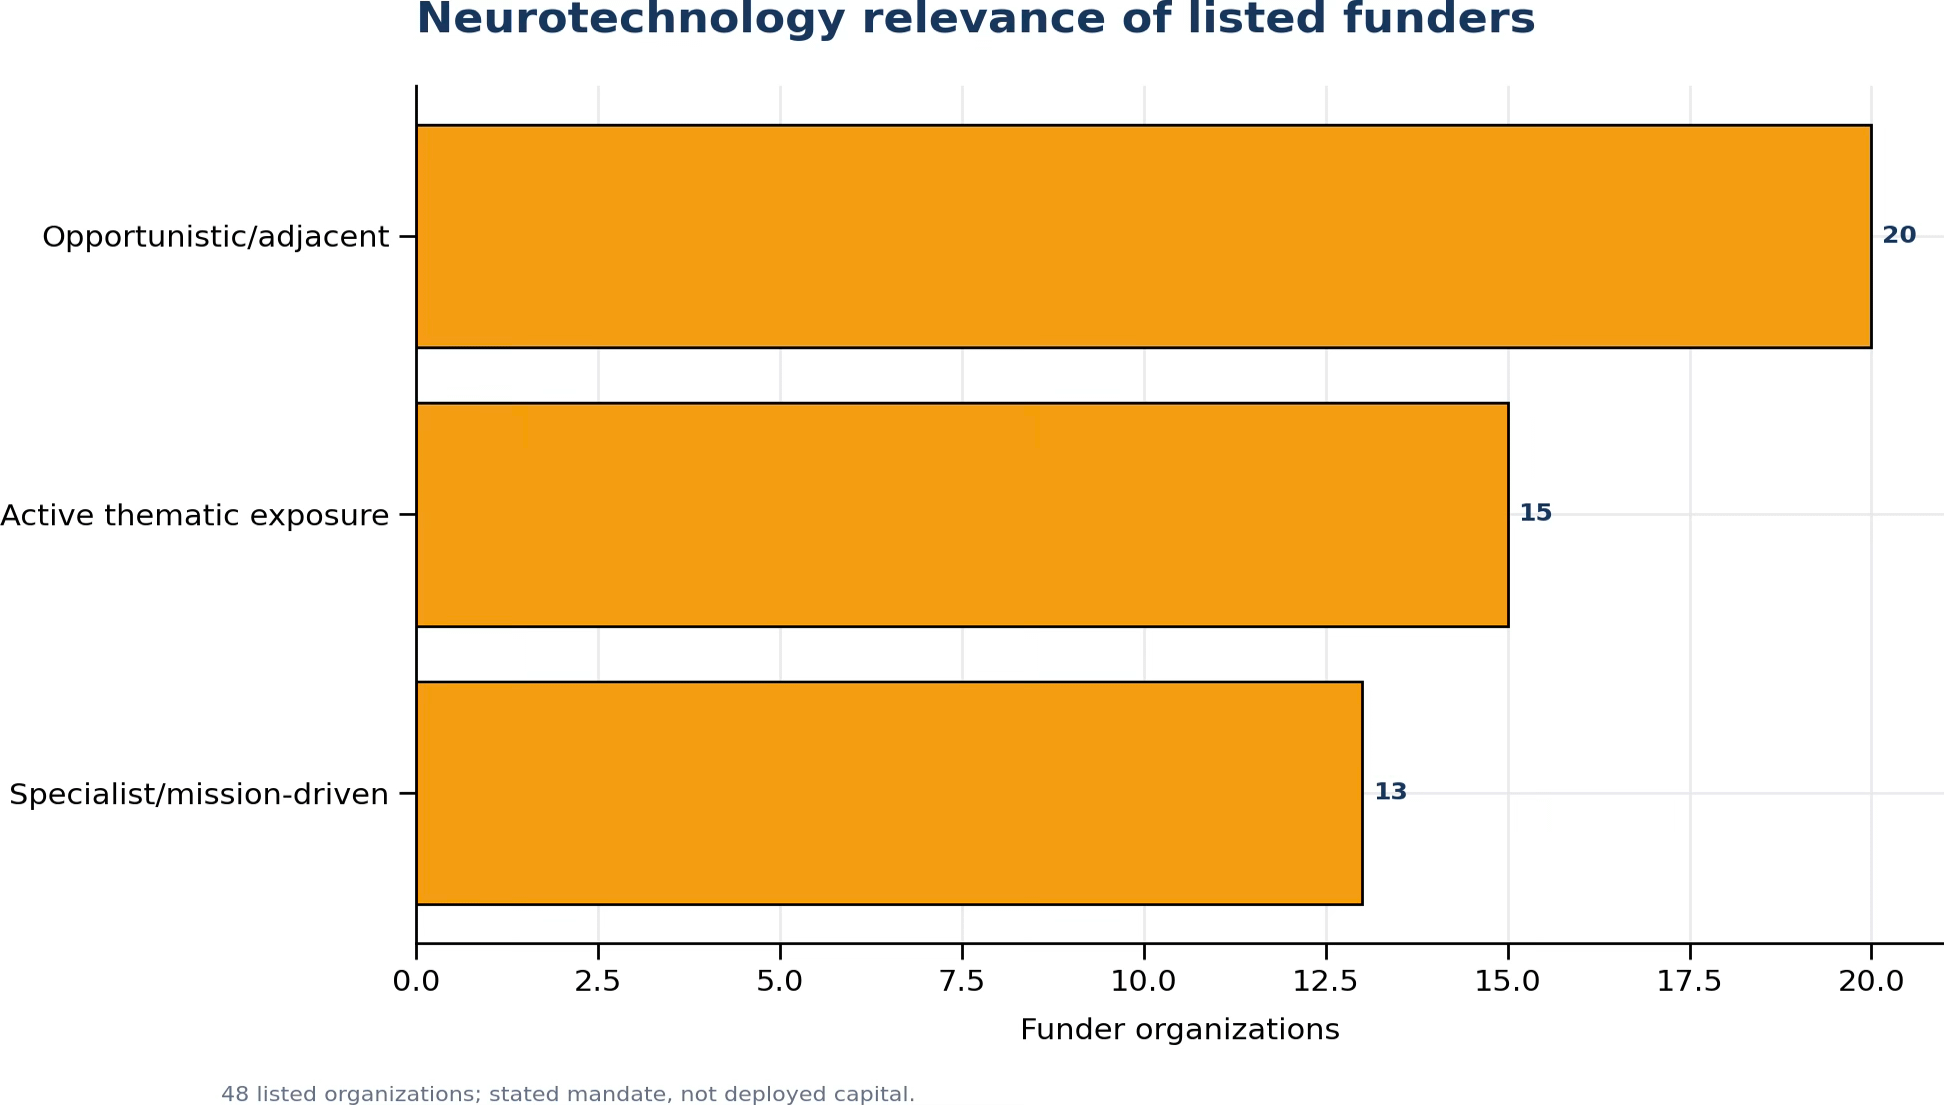
Figure 12. Neurotechnology relevance of 48 listed funder organizations.
Thirteen funders are classified as specialist or mission-driven, 15 have active thematic exposure, and 20 are opportunistic or adjacent. Forty-four are oriented toward medical or research applications. These classifications describe publicly stated mandates and documented activity; they do not measure capital availability, deployment, or investment performance.
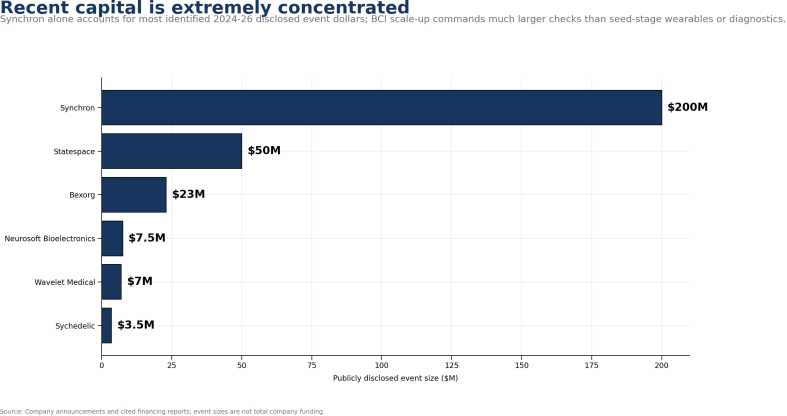
Figure 13. Concentration of recent disclosed capital in large, marquee neurotechnology transactions.
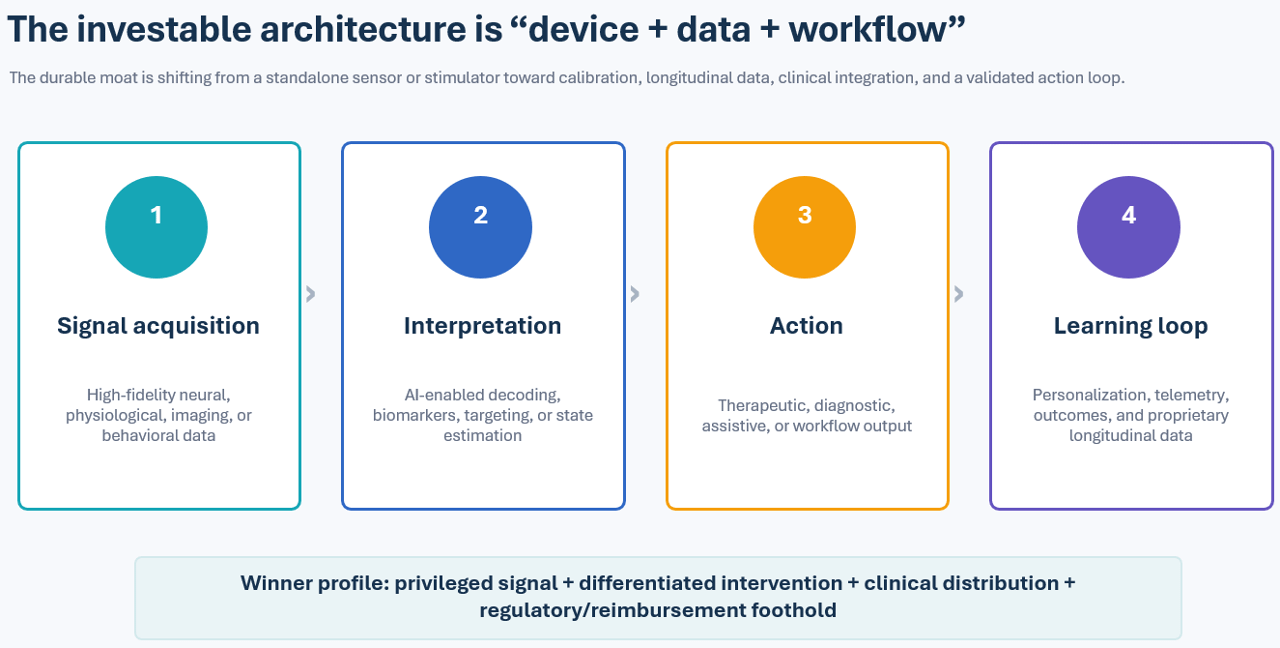
Figure 14. Investable architectures across the regional neurotechnology landscape.
Figure 15. Most active investors with a documented presence in the regional neurotechnology ecosystem.
12
Ecosystem relationships: origins, collaboration and deployment
A documented network of institutional origins, collaborations, and deployment relationships
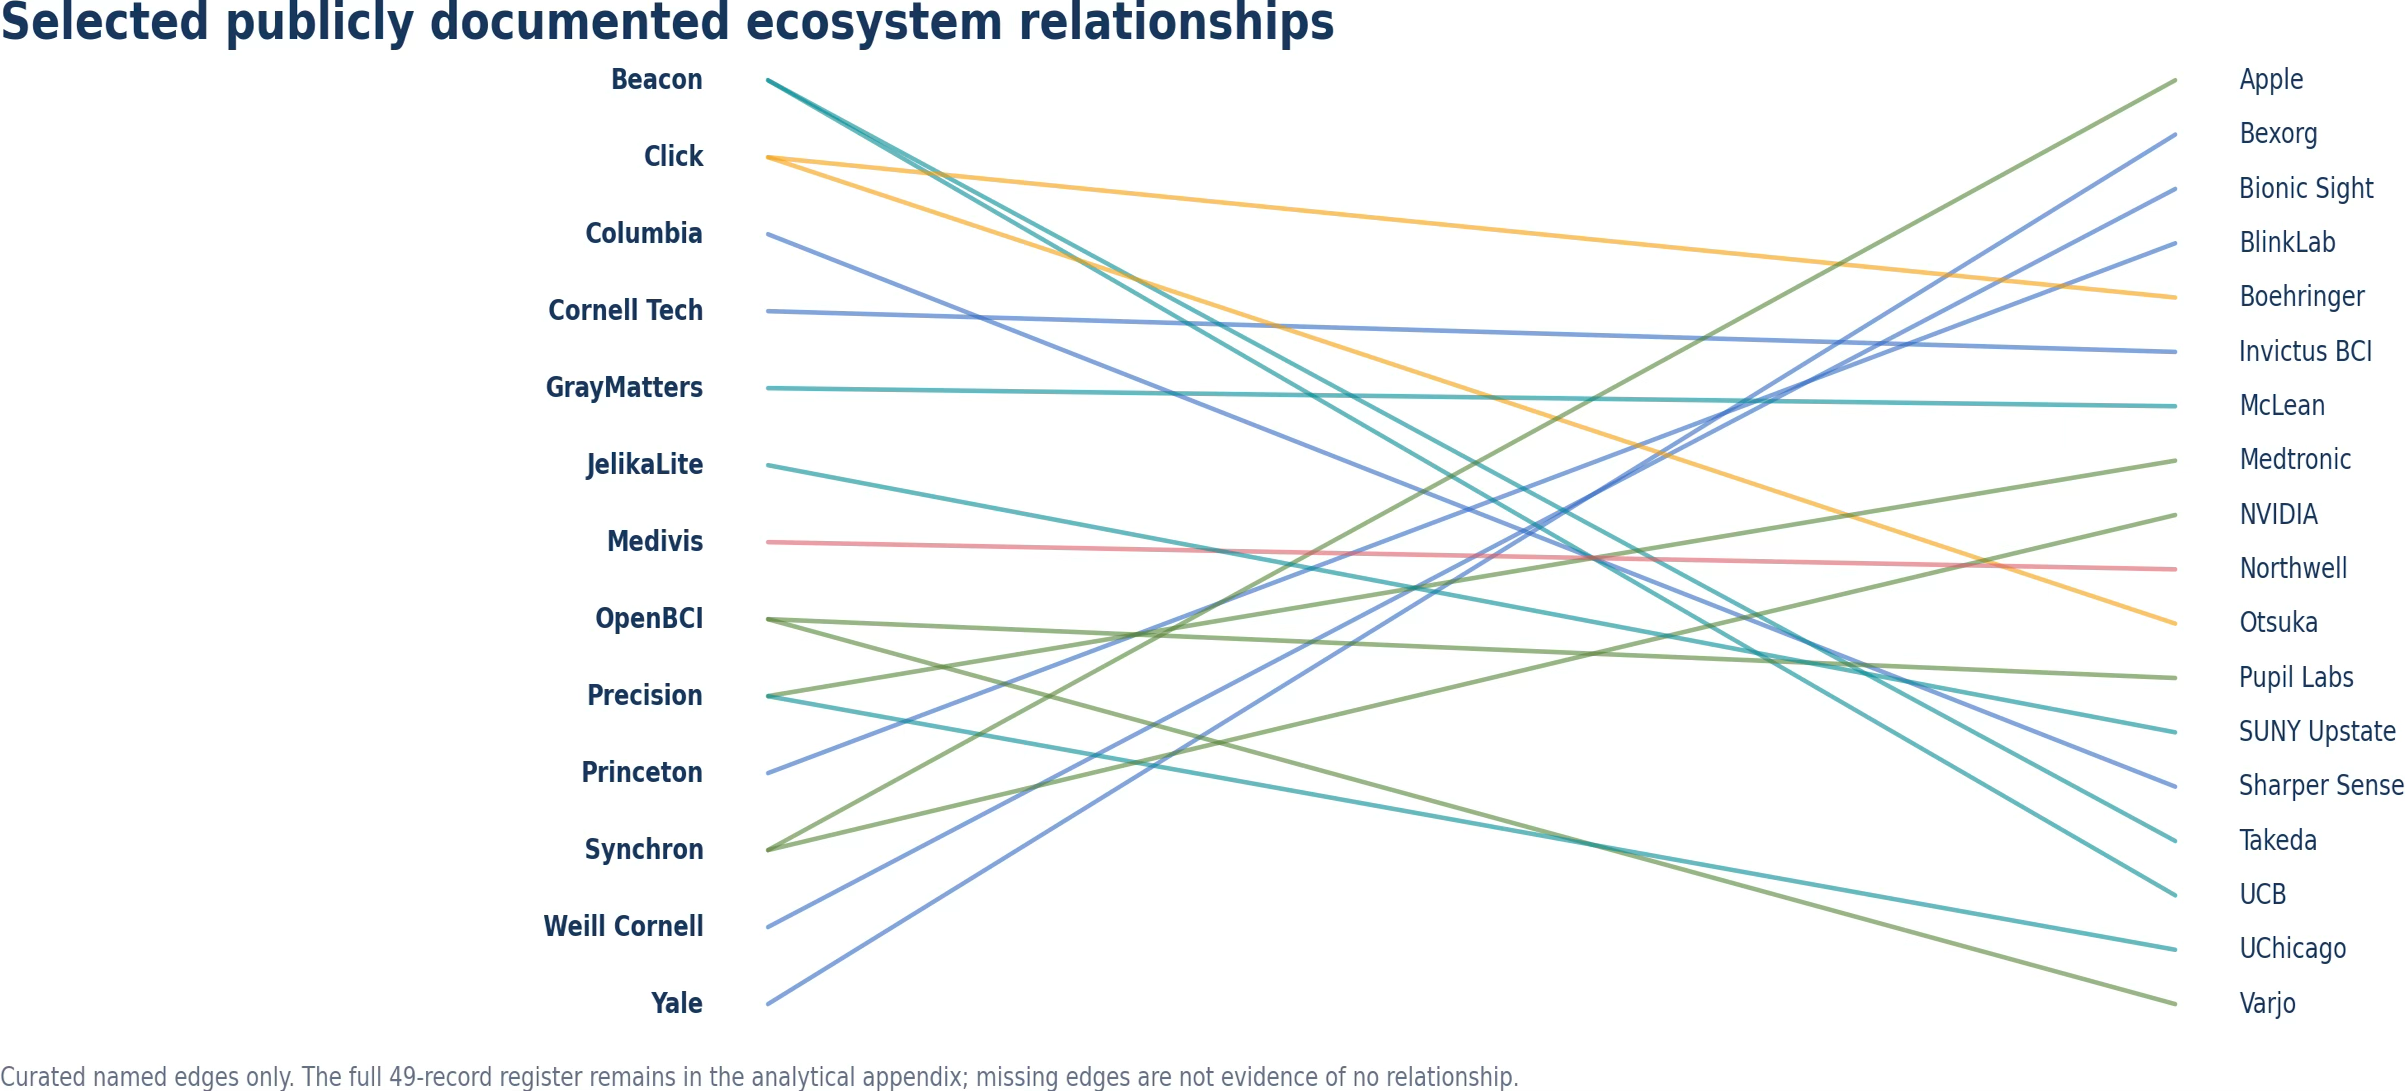
Figure 16. Selected publicly documented institutional and commercial relationships.
13
Laboratories: a broad, platform-heavy research base
The 59-lab cohort combines computation, interfaces, recordings, imaging, rehabilitation, and stimulation.
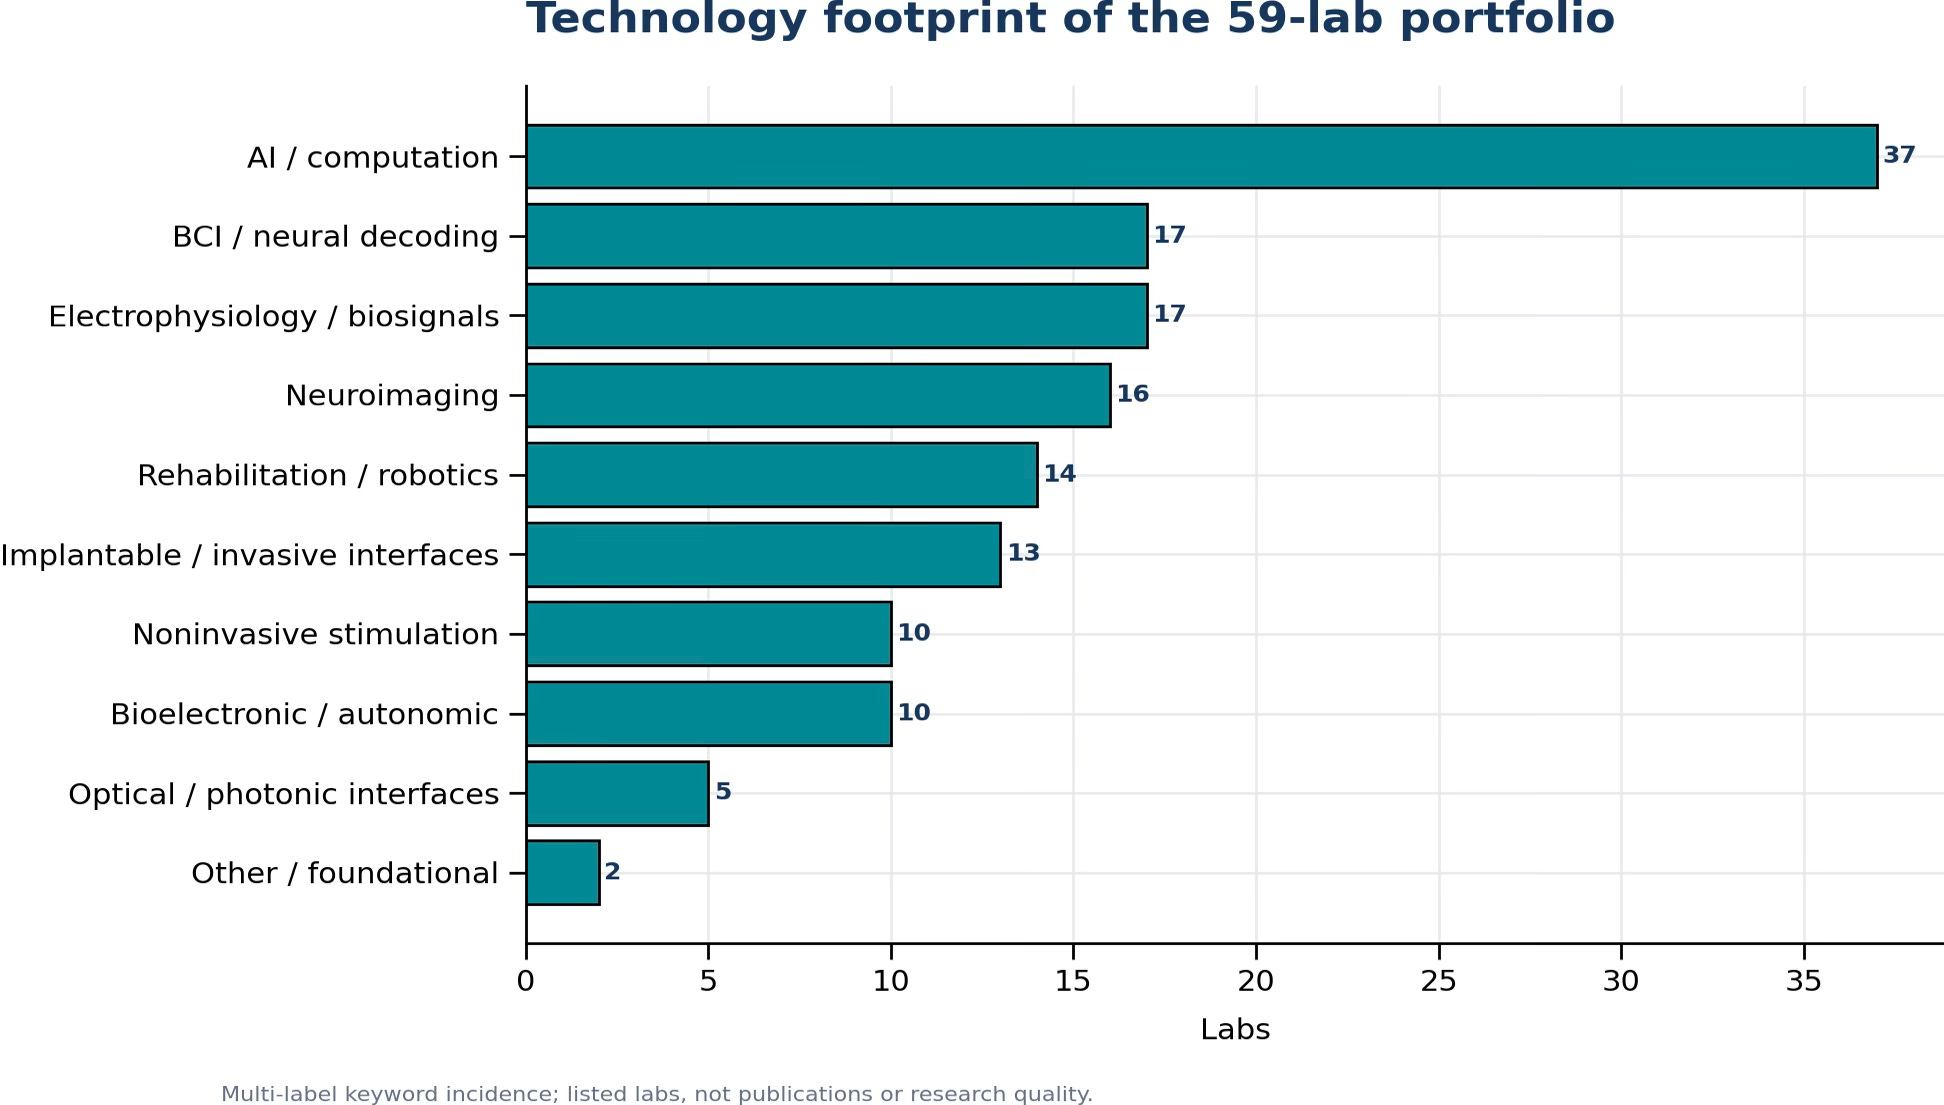
Figure 17. Technology footprint of the 59-laboratory portfolio.
Thirty-eight listed labs are coded clinical/translational and 21 foundational or methods-oriented. AI/computation appears in 37 descriptions; BCI and electrophysiology in 17 each; neuroimaging in 16; rehabilitation/robotics in 14; and implantable or invasive interfaces in 13.
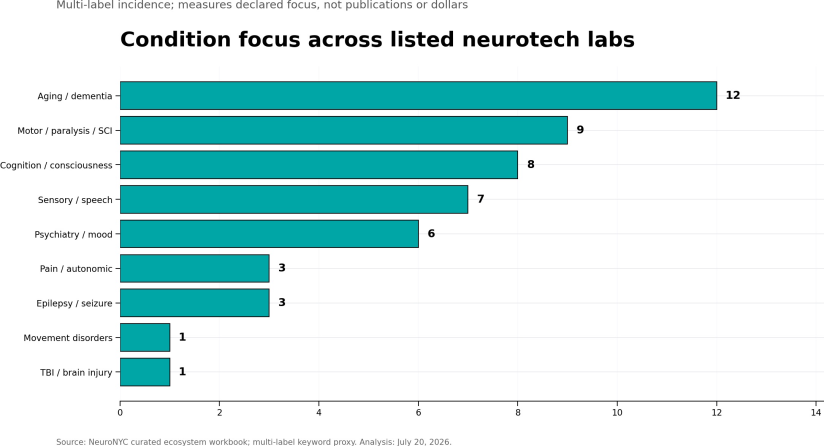
Figure 18. Conditions most frequently represented in the regional laboratory cohort.
Figure 19. Institutions with the largest number of neurotechnology-focused laboratories in the curated cohort.
14
Research output and clinical-trial activity
2025 reached a query-scoped publication peak and a higher trial-start count than 2024.
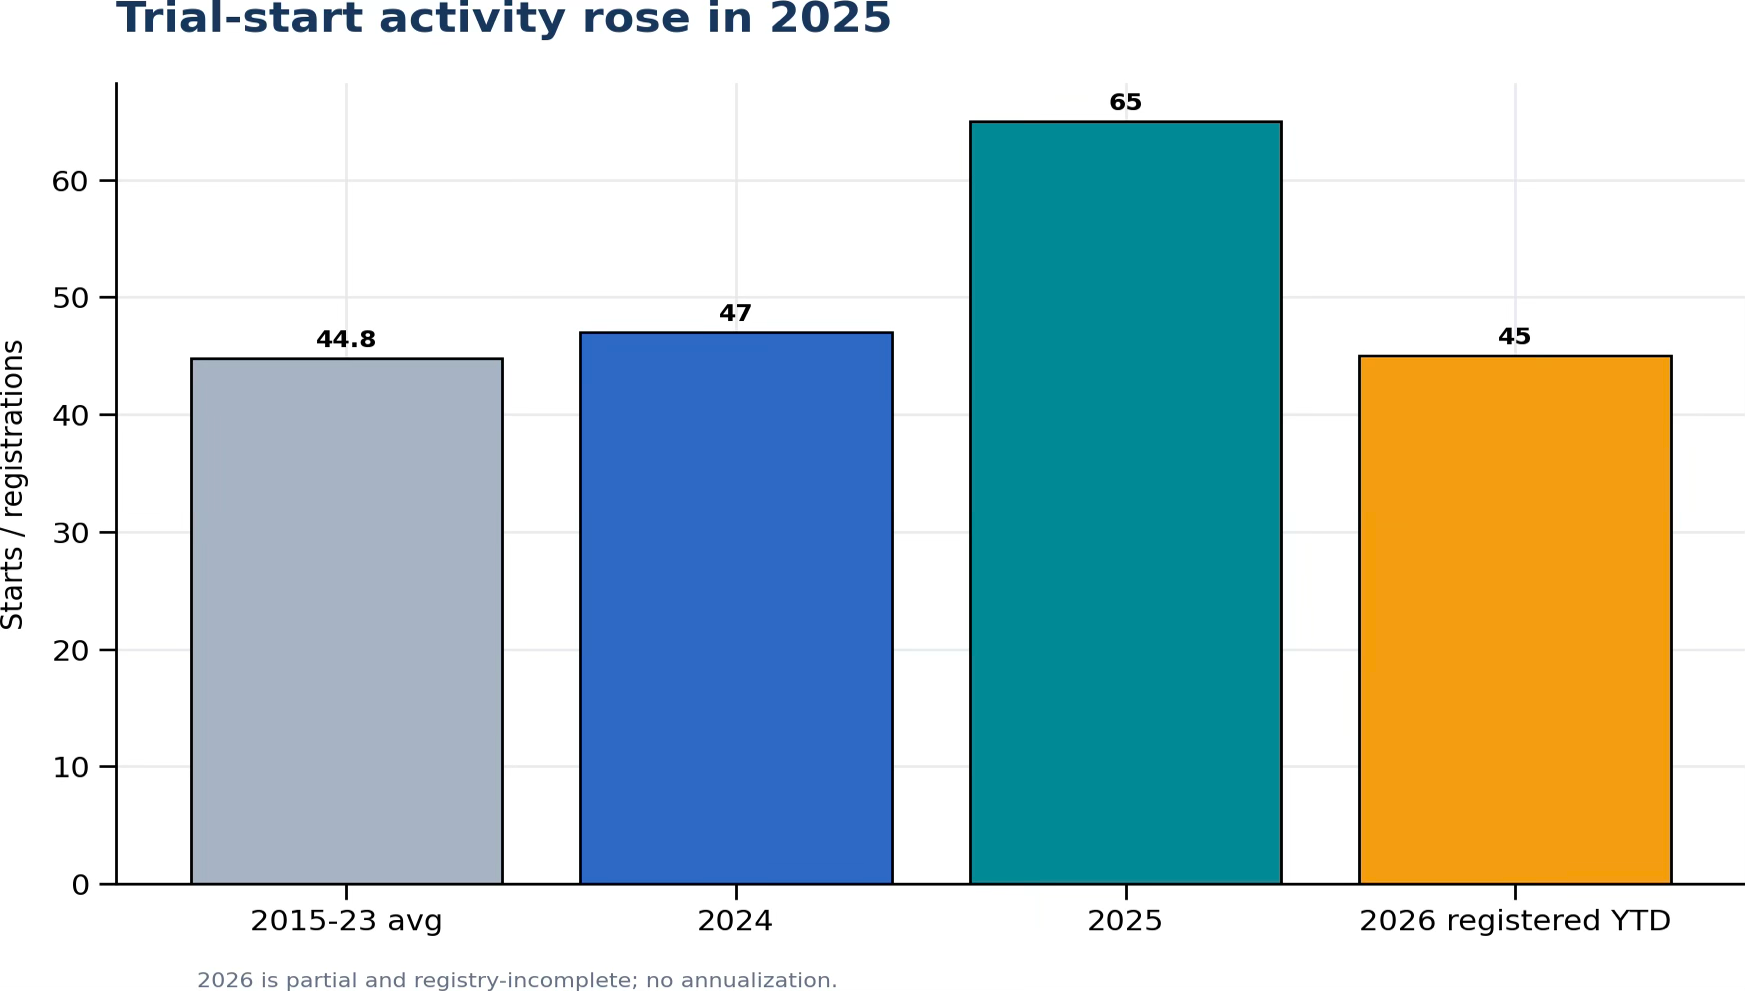
Figure 20. Comparable annual views of clinical-trial starts and 2026 registrations. Year-to-date data are current through July 21, 2026.
960 publications in 2025: 11.9% above 2024 and 25% above 2023.
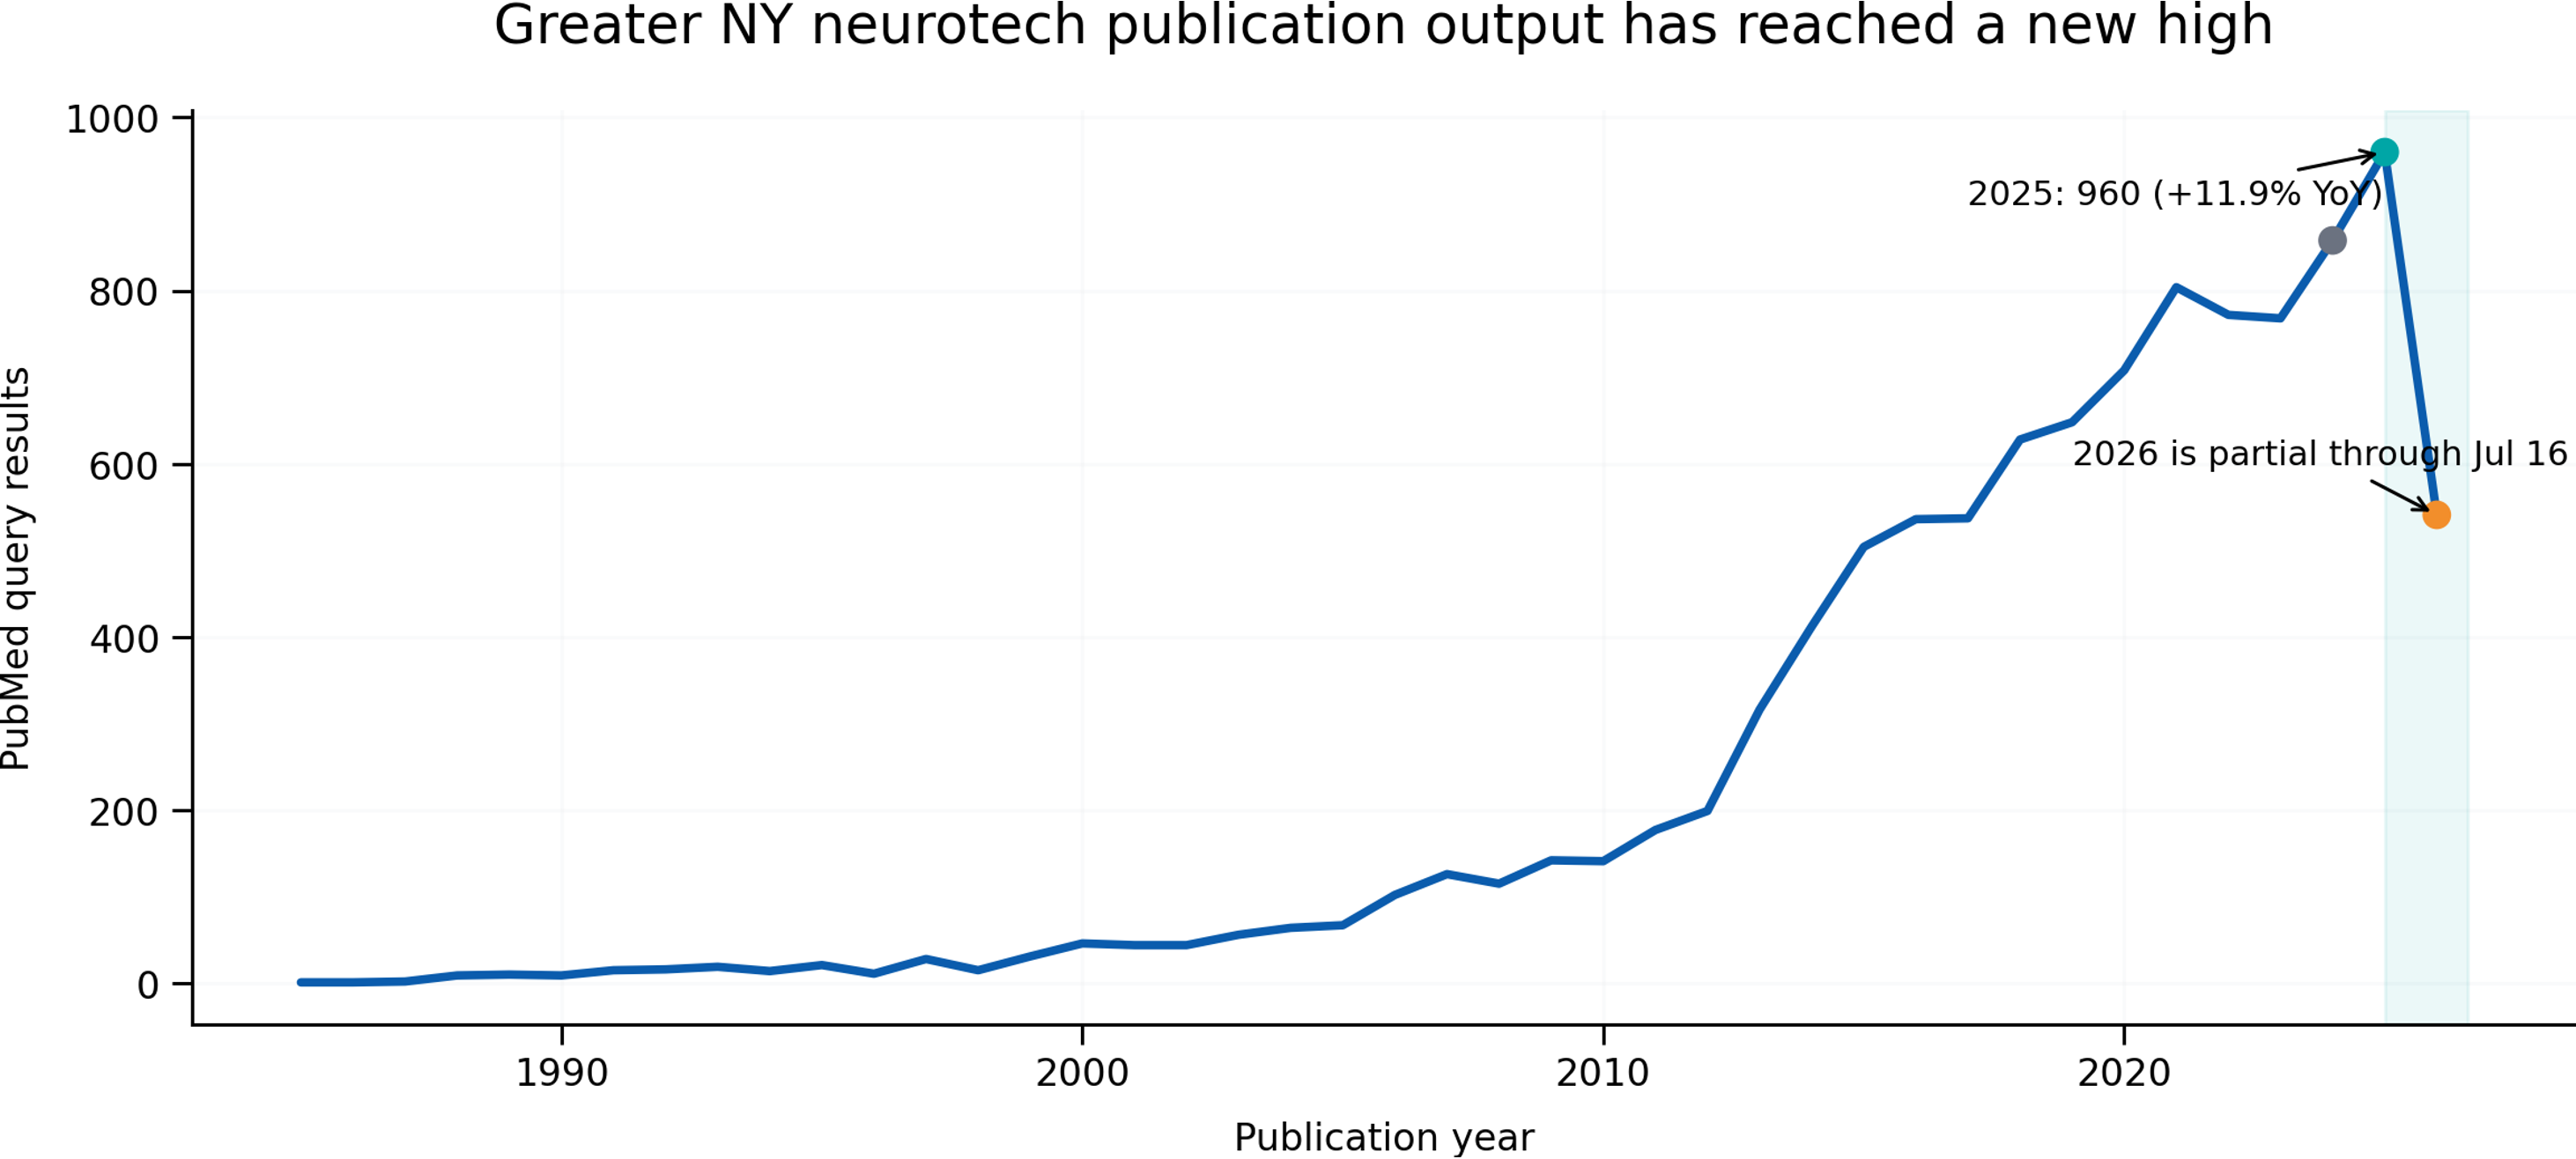
Figure 21. Annual neurotechnology publication count for the query-defined regional cohort.
15
Clinical-trial momentum
Recent movement in emerging categories alongside established trial modalities
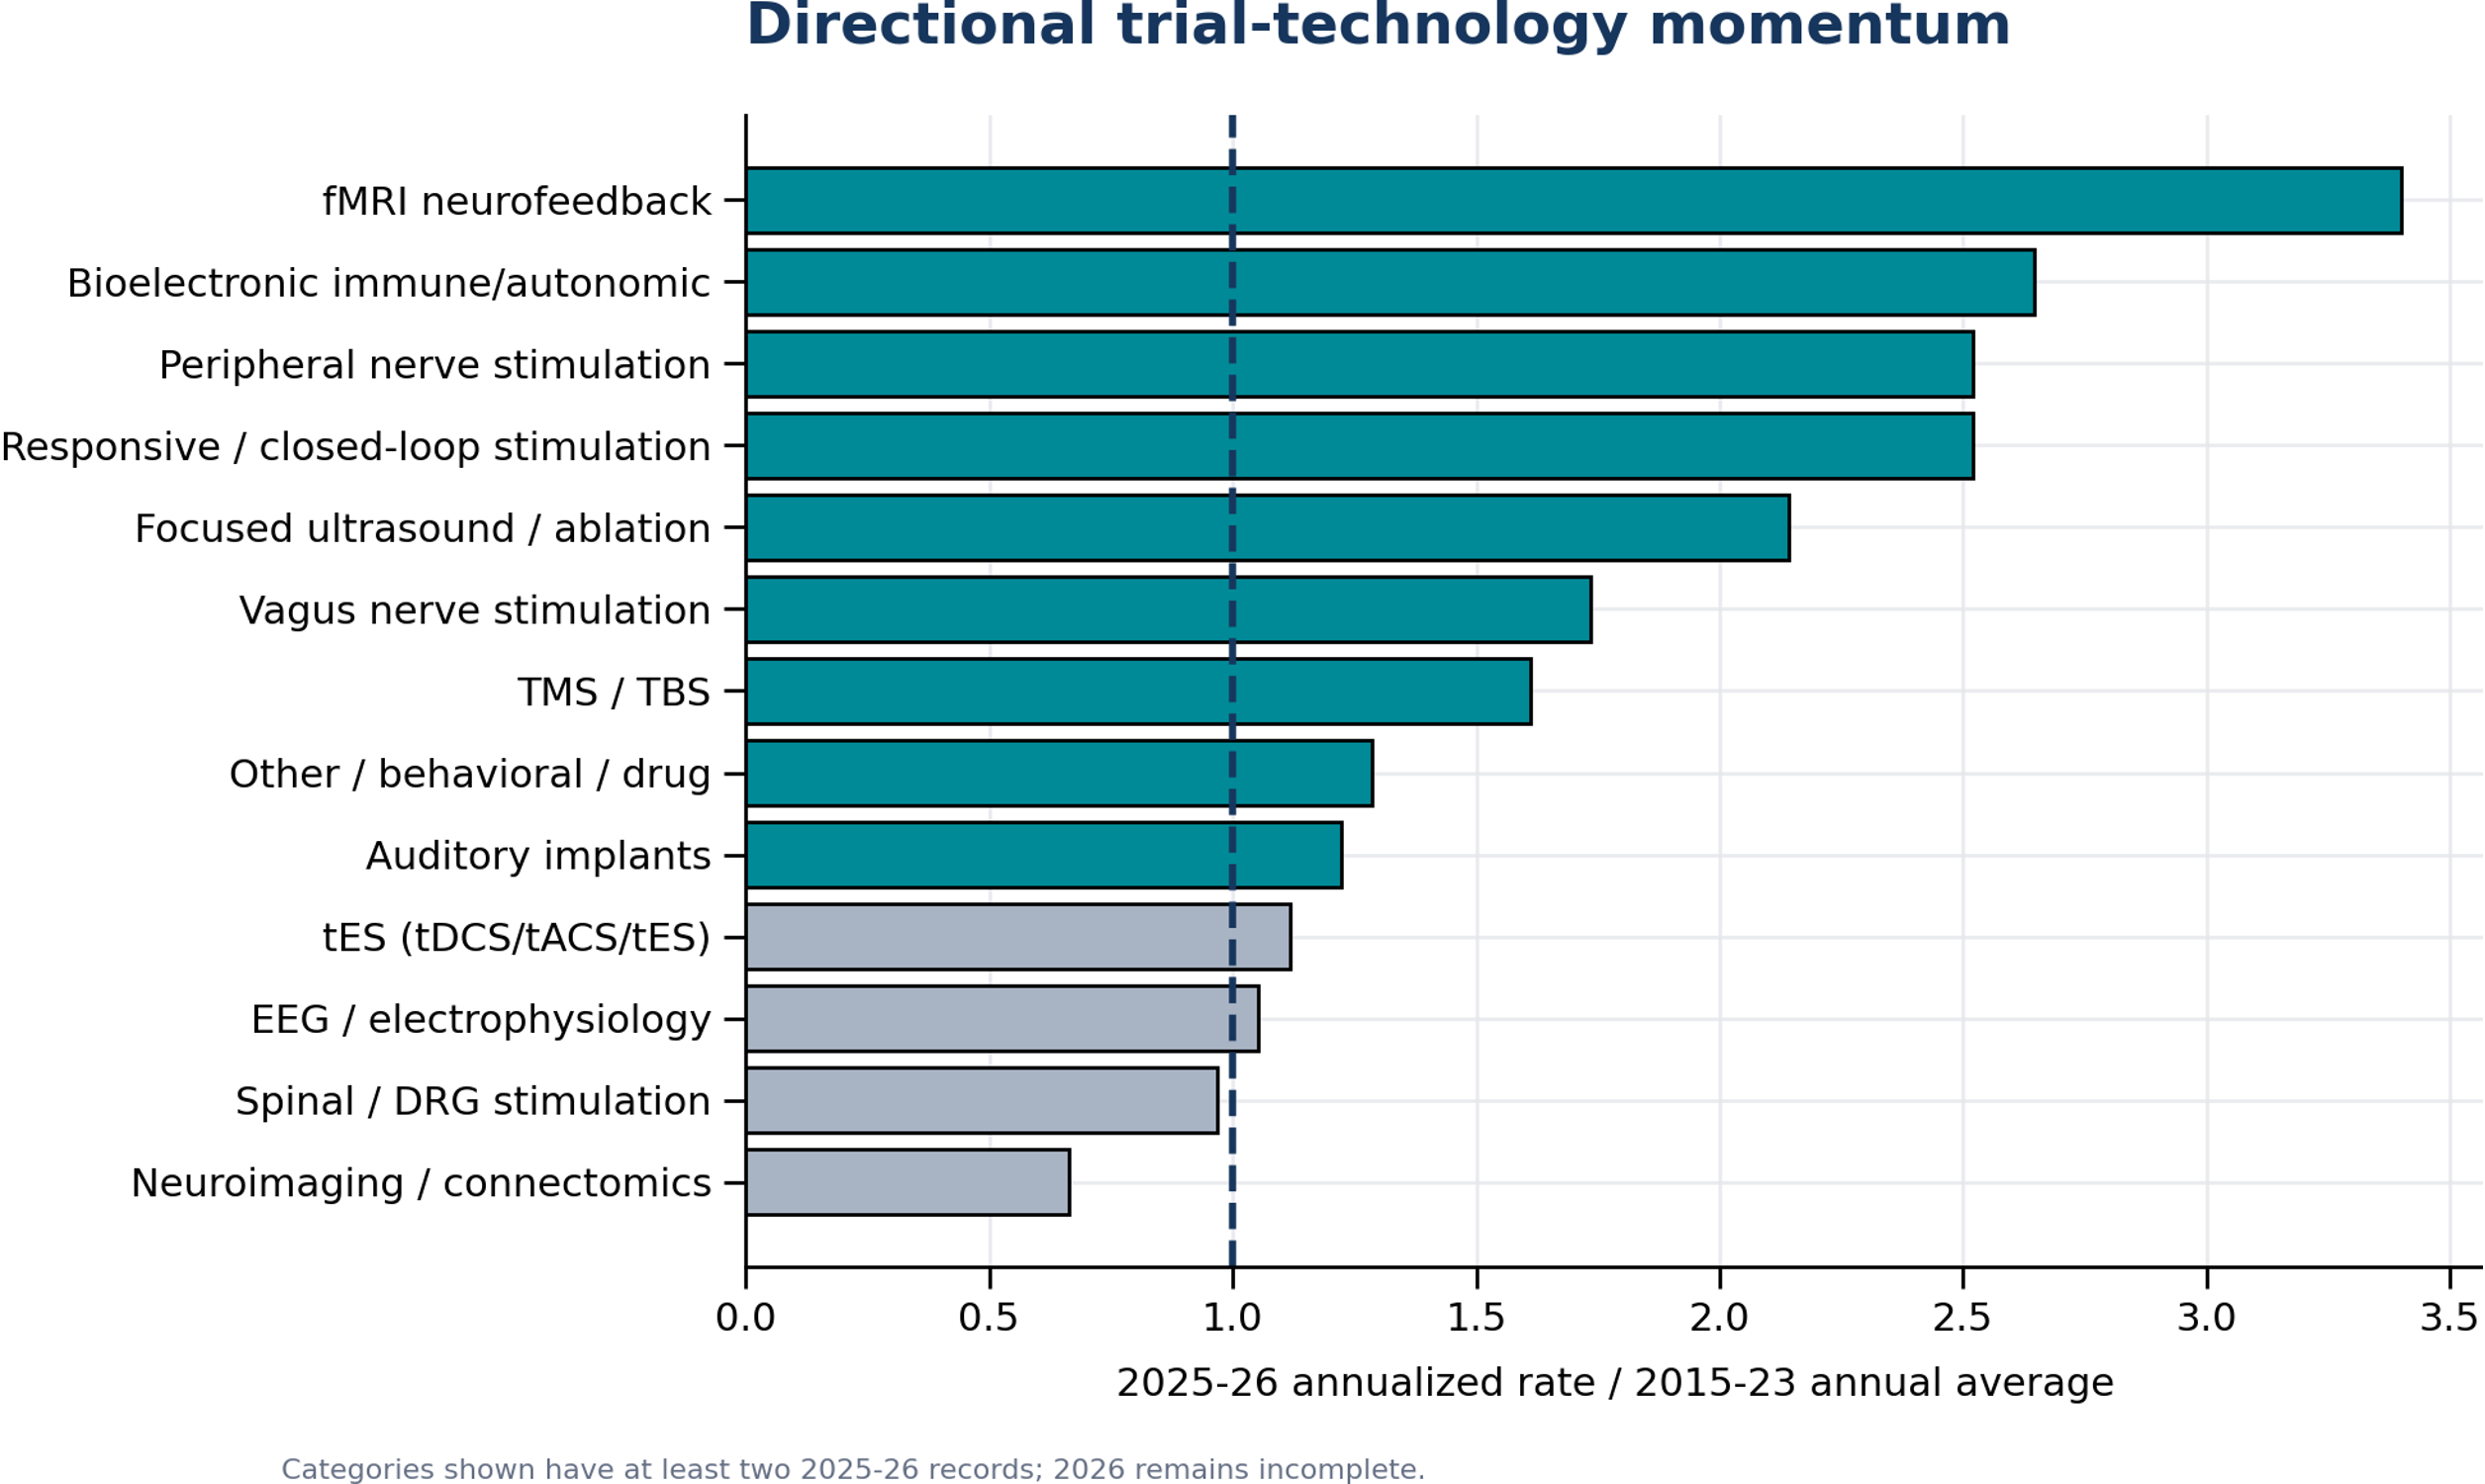
Figure 22A. Directional momentum by technology category.
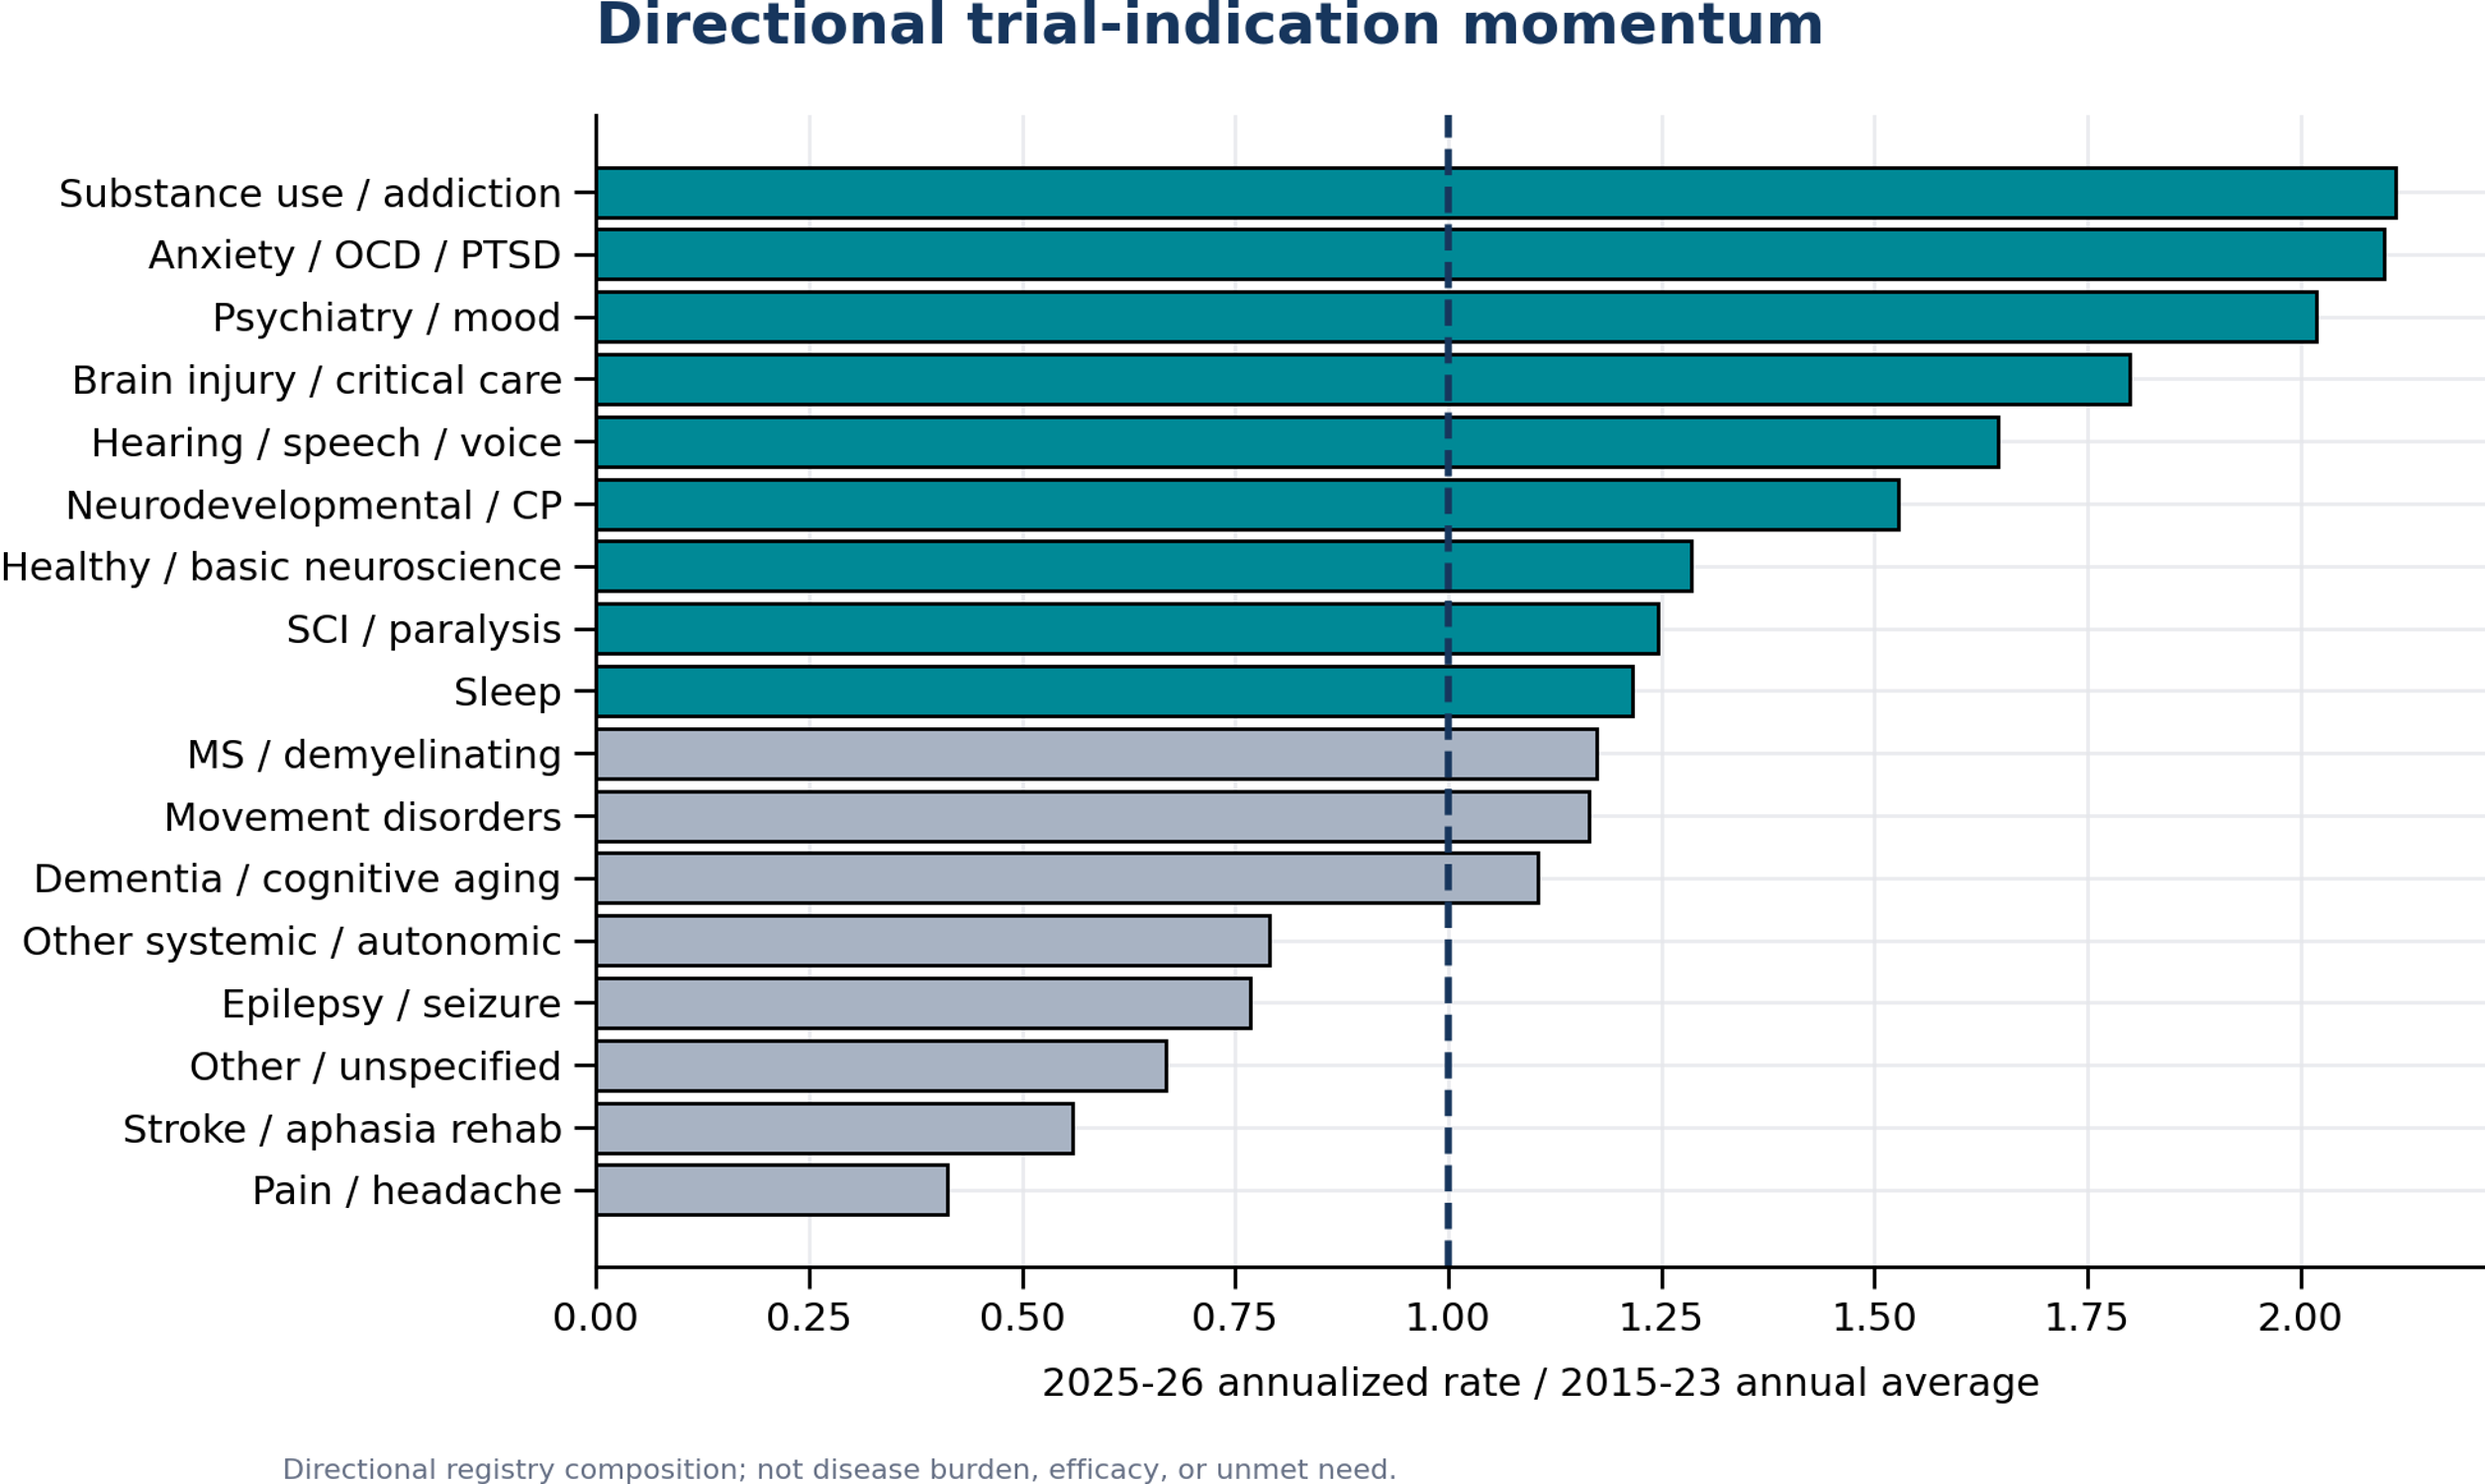
Figure 22B. Directional momentum by indication category.
16
Institutional specialization and the frontier/backbone distinction
Research and trial leadership is distributed across institutions with differentiated modality and clinical strengths.
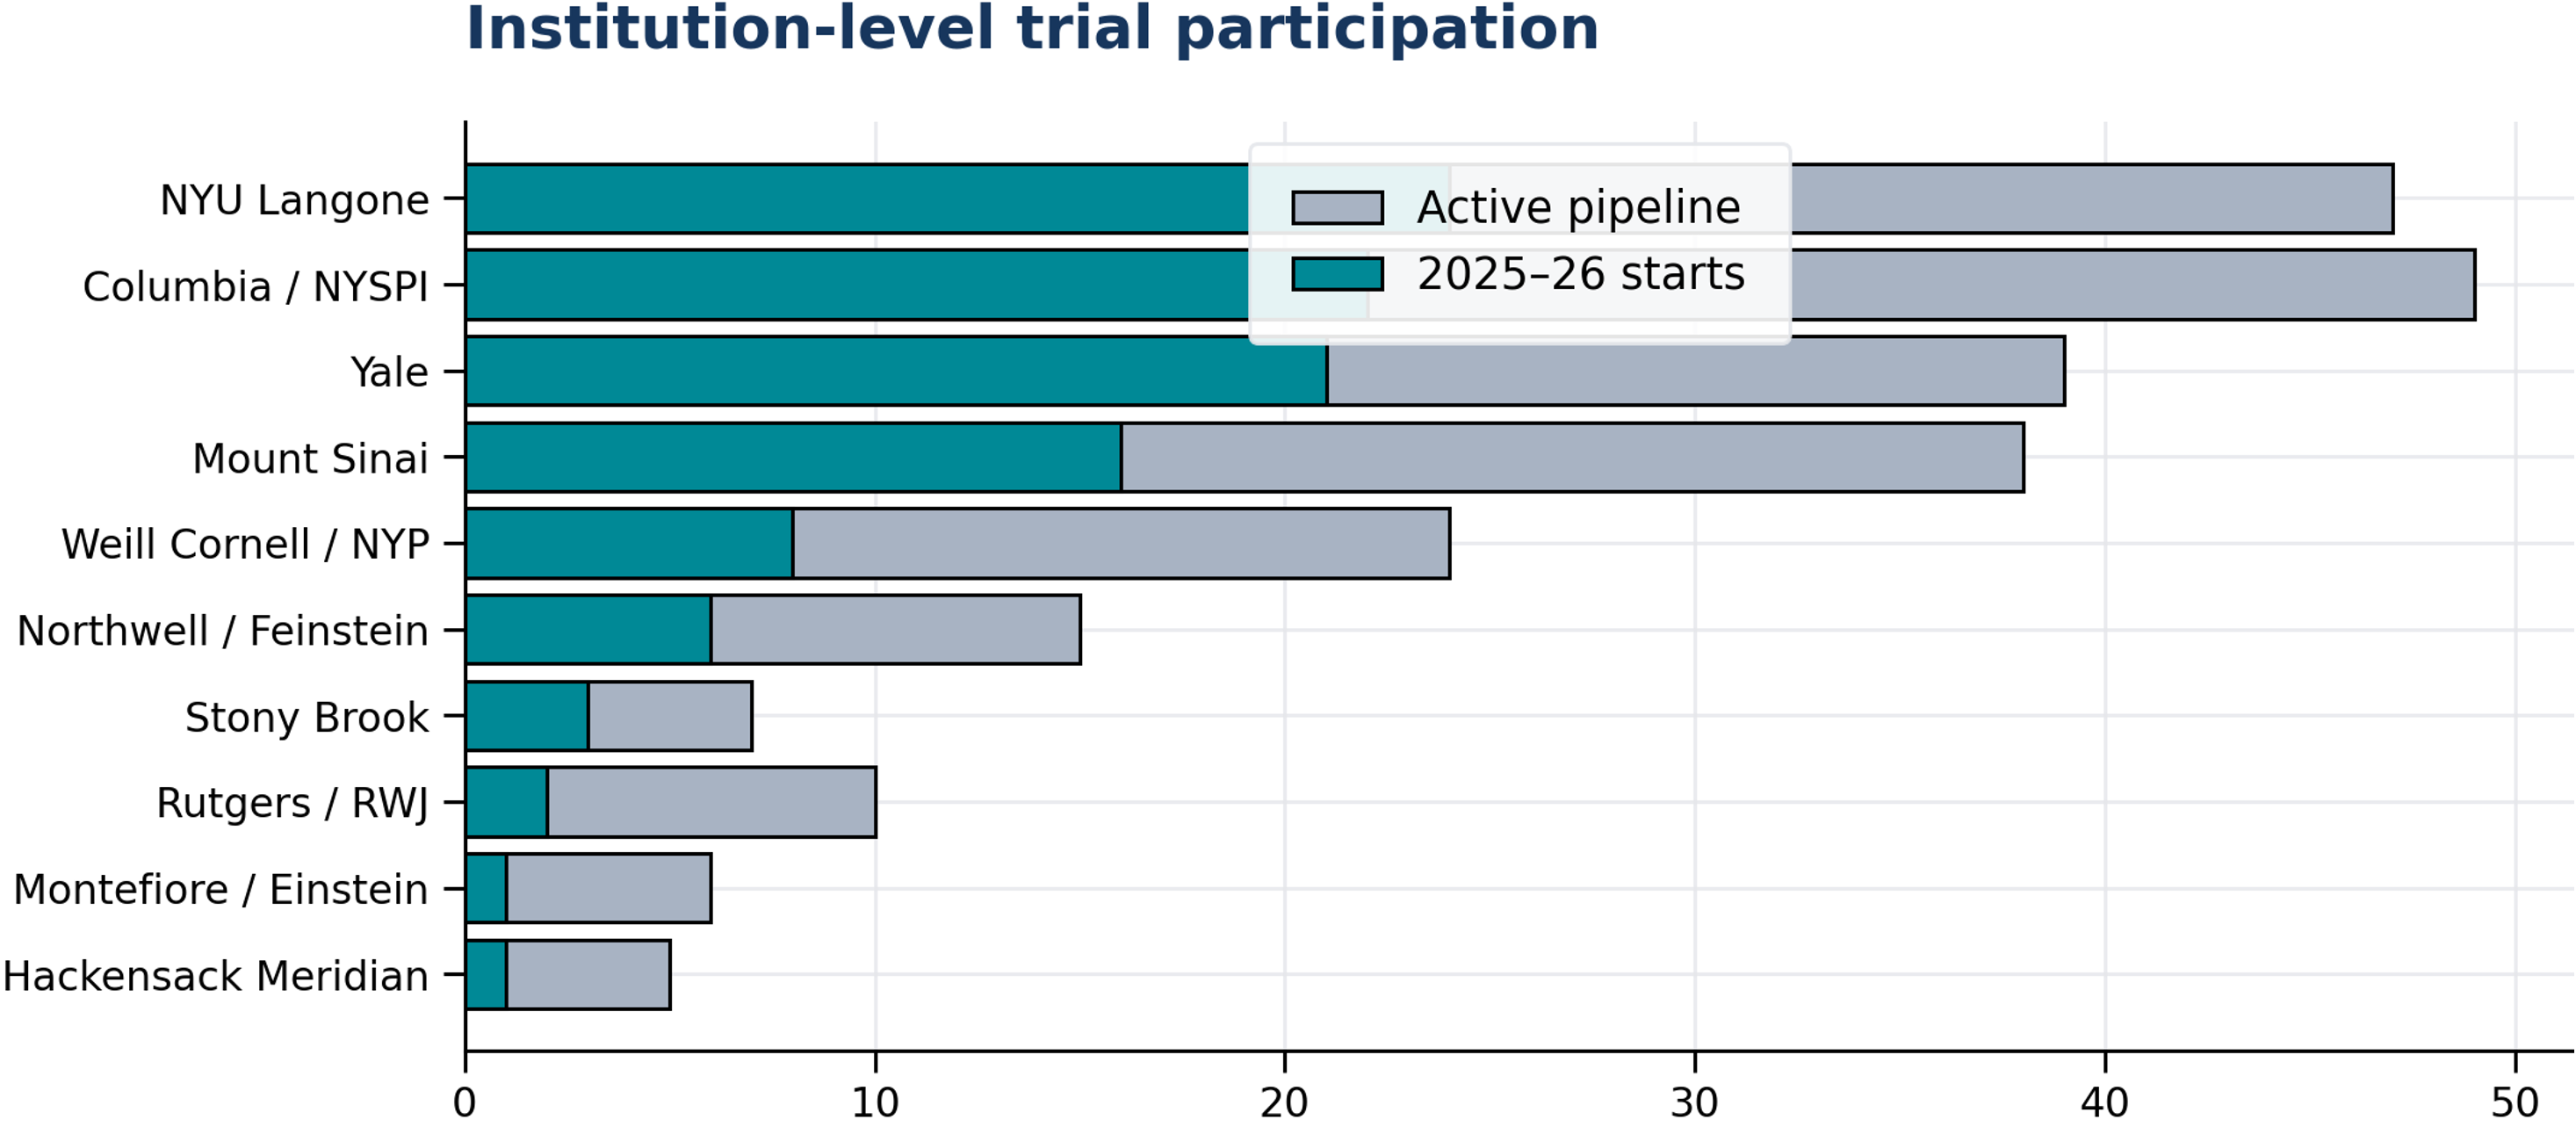
Figure 23. Active pipelines and 2025-2026 trial starts for the largest institutional cohorts.
NYU Langone, Columbia/NYSPI, Yale, and Mount Sinai have the largest recent-start counts in the supplied institution table. This reflects registry participation and source normalization, not exclusive leadership, quality or ownership of each study. Multisite trials can involve more than one institution.
Established base: imaging, EEG, TMS, and tES have substantial historical trial volume. Emerging categories: closed-loop, peripheral/autonomic, and focused-ultrasound protocols show recent directional momentum.
17
Integrated synthesis: technology across verticals
The ecosystem is not vertically uniform; technologies appear differently in research, products, funding mandates, and care.
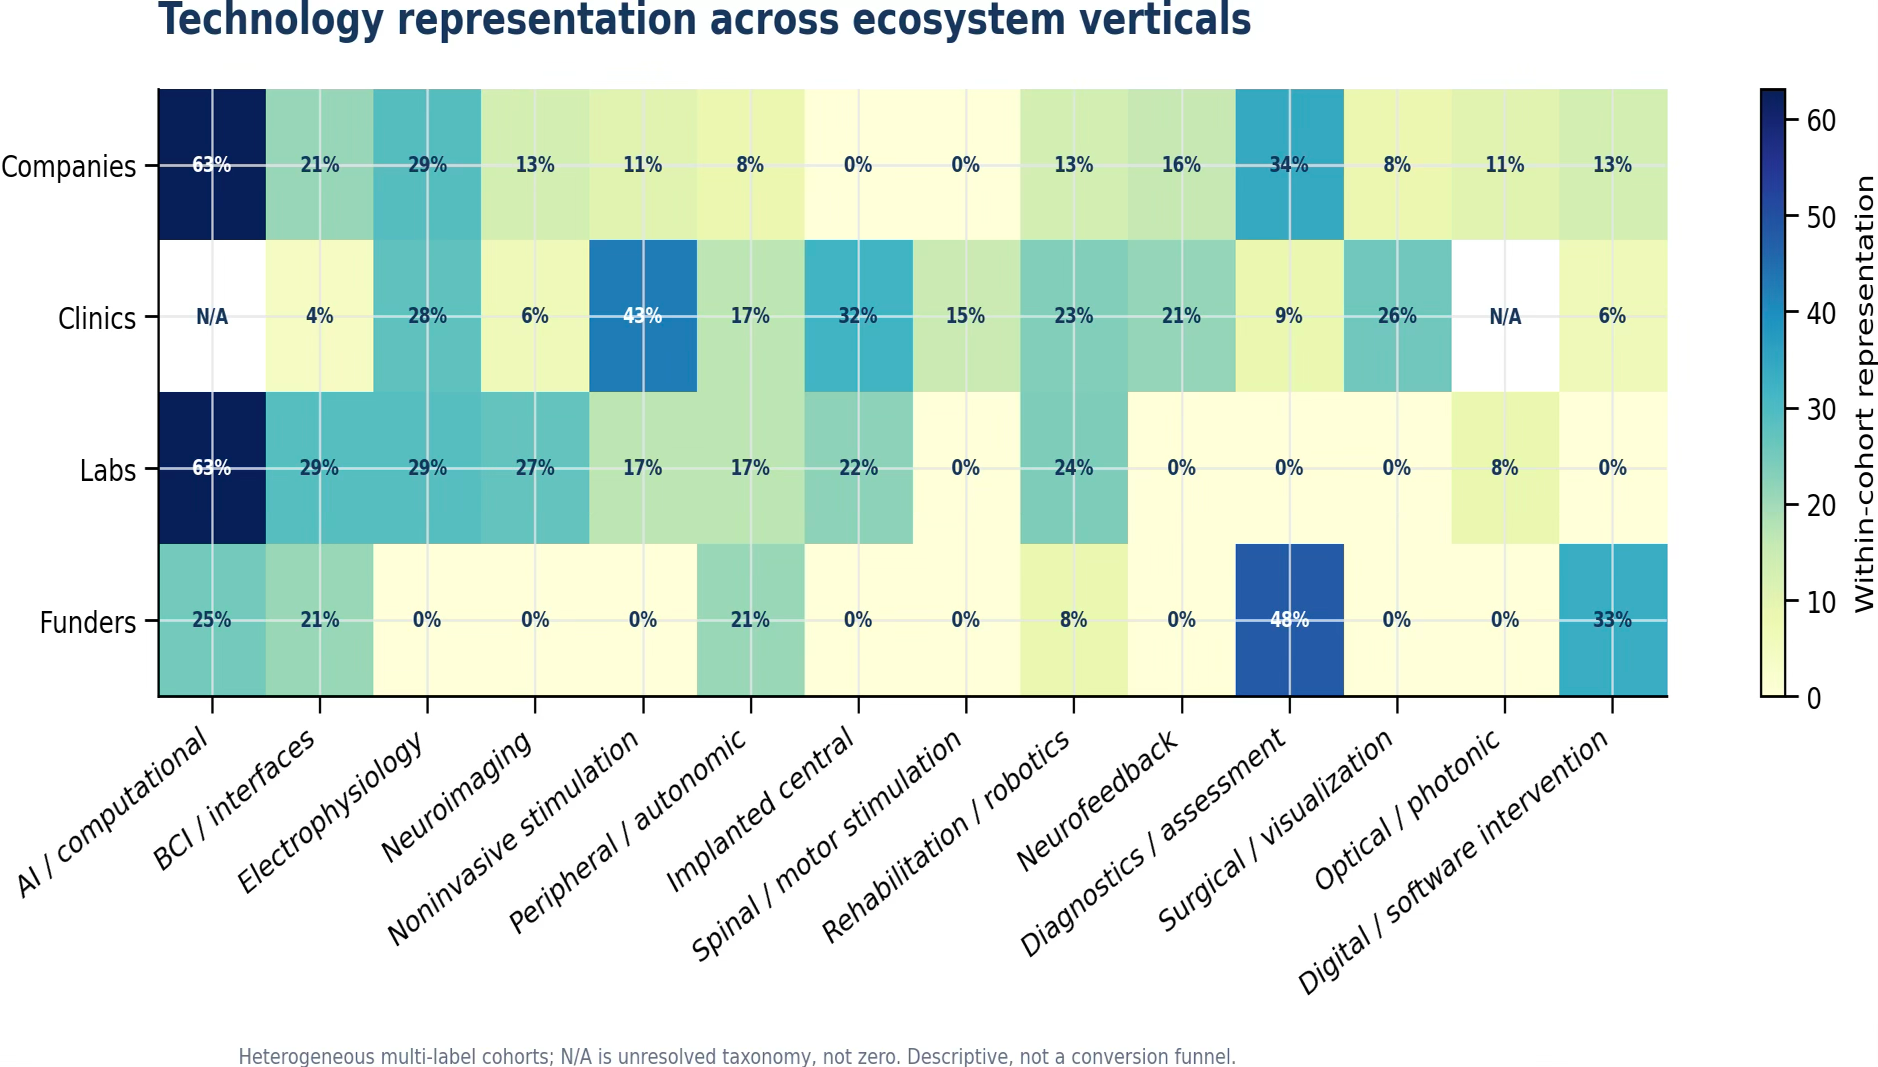
Figure 24. Technology representation within each ecosystem segment: companies, clinical programs, laboratories, and funders.
The heat map compares normalized representation within heterogeneous cohorts. AI/computational work is highly represented in lab and company descriptions. Noninvasive and implanted stimulation have stronger downstream clinical representation. Diagnostics and digital-health categories receive substantial explicit funder attention.
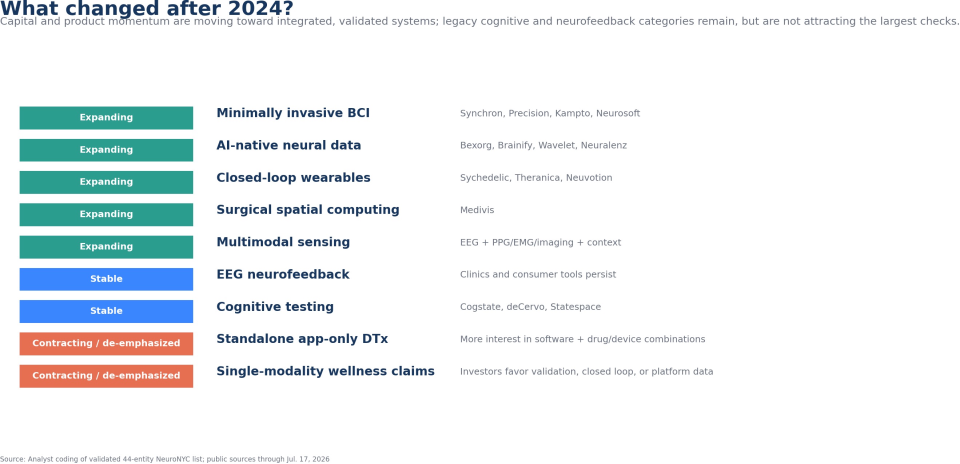
Figure 25. Ongoing structural changes across the regional neurotechnology ecosystem.
18
Integrated synthesis: conditions across stages
Research, company, trial, and care portfolios emphasize different clinical and functional targets.
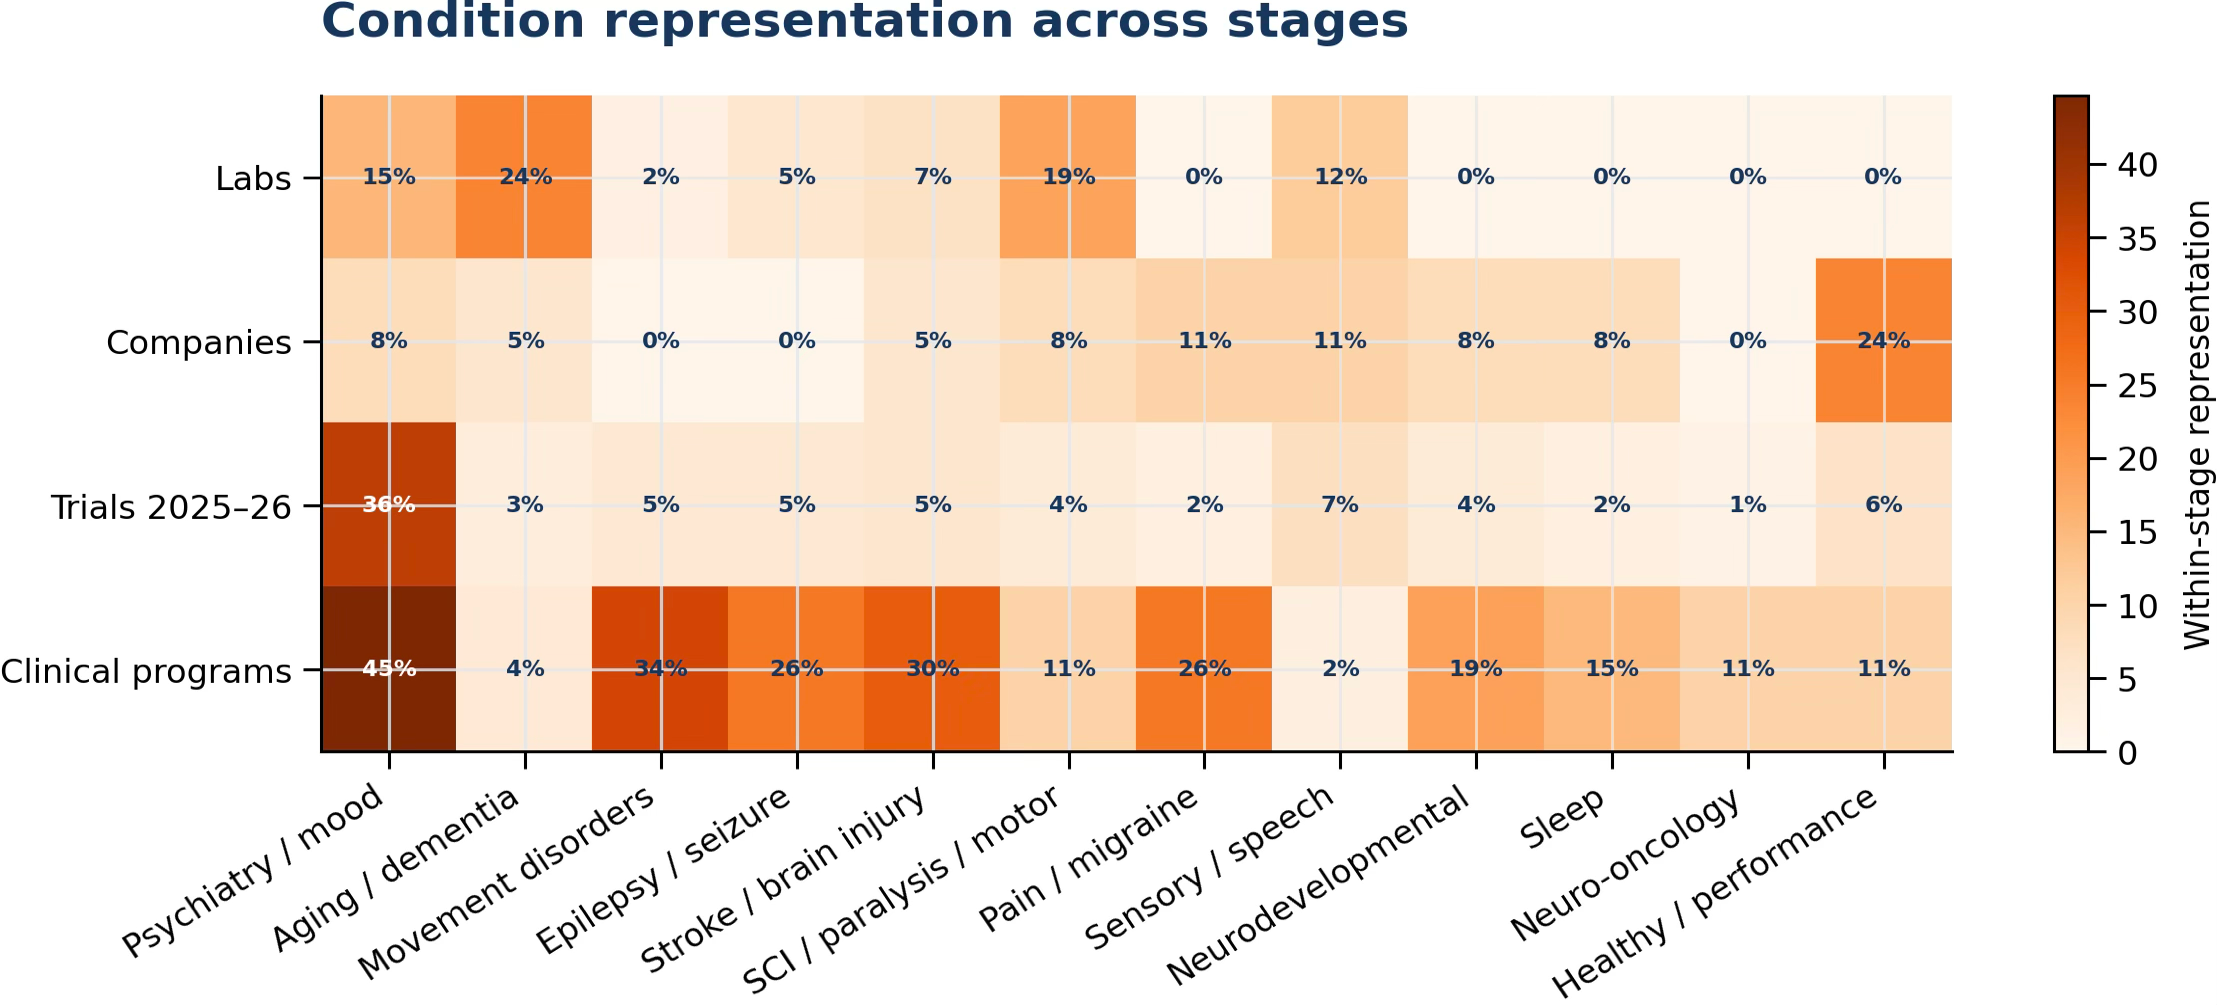
Figure 26. Within-stage representation of conditions and use cases.
Psychiatric categories are strongly represented in recent trial starts and listed clinical programs. Movement disorders, epilepsy, pain, and stroke/brain injury have substantial clinical-program representation. The lab portfolio emphasizes aging/dementia, motor/paralysis/SCI, psychiatry, and sensory/speech work, while many labs remain platform-oriented rather than condition-specific.
19
Policy and public infrastructure
Neural-data rules and selected public investments across the region
Figure 27. Comparison of neural-data policy across the core states in the regional cohort.
20
Conclusions: from evidence to action
Economic-development implications of a diverse regional neurotechnology base
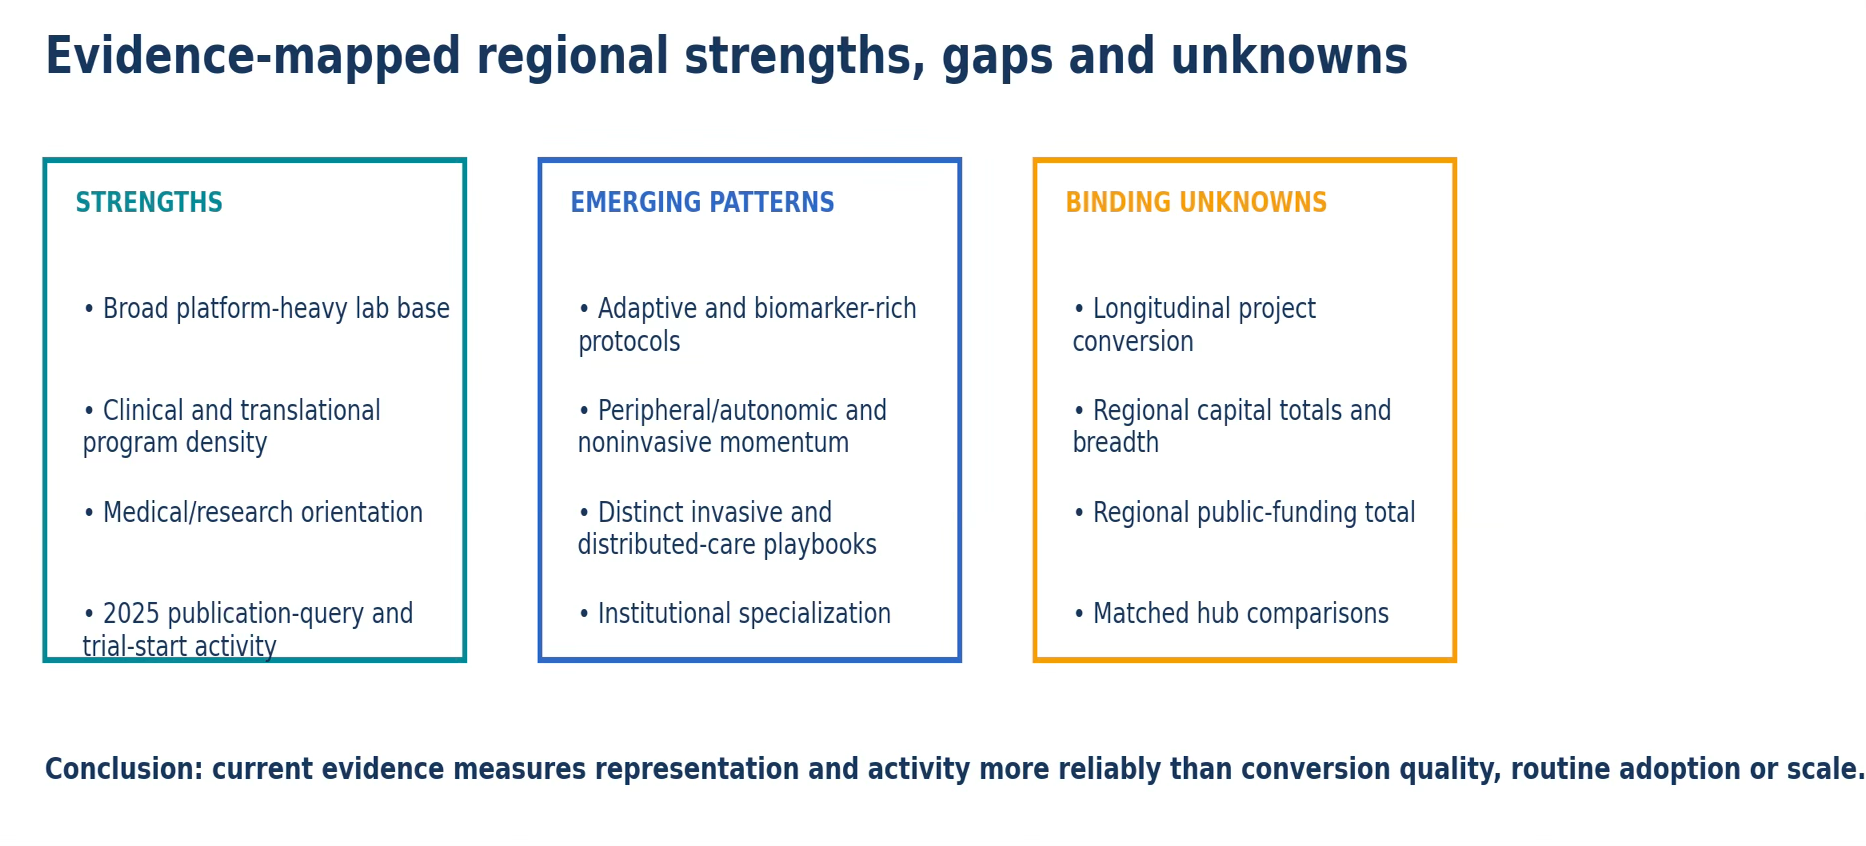
Figure 28. Evidence-mapped strengths, emerging patterns, and binding unknowns.
Greater New York contains a broad neurotechnology base spanning scientific platforms, clinical programs, product companies, and multiple capital sources. The region does not converge on one modality: sensing, stimulation, imaging, computation, rehabilitation, surgical systems, and software coexist around different use cases.
What the dataset supports. Greater New York has a substantial research and clinical base, a heterogeneous company portfolio, and multiple forms of capital exposure. It also shows uneven commercial maturity, limited visibility into deployed capital, fragmented access pathways, and incomplete public evidence on the conversion of regional science into scaled products and retained economic activity. These findings establish where additional measurement and coordination are warranted; they do not by themselves prove that any specific public intervention will produce a given economic outcome.
Economic-development implications. For NYCEDC and related stakeholders, the evidence suggests testing interventions that reduce the friction between discovery, validation, adoption, and regional scale-up. Candidate priorities include translational infrastructure; pilot and procurement pathways with health systems and public agencies; shared clinical-validation capabilities; specialized manufacturing and supply-chain development; stronger founder–investor connectivity; workforce programs spanning technical, clinical, regulatory, and manufacturing roles; regulatory and reimbursement support; and practical neural-data governance. These interventions align with the city’s broader emphasis on commercializing research, expanding specialized space, and building an accessible life-sciences workforce, but their design should be neurotechnology-specific and evaluated against measurable conversion outcomes.
Measurement agenda. The next phase should track company formation and survival, follow-on financing by stage, pilots and procurement contracts, regulatory milestones, clinical-validation timelines, manufacturing location, job creation and occupational mix, reimbursement progress, and the share of regional intellectual property that becomes locally scaled activity. This would allow future editions to distinguish ecosystem breadth from economic conversion and to assess which interventions are producing durable regional value.
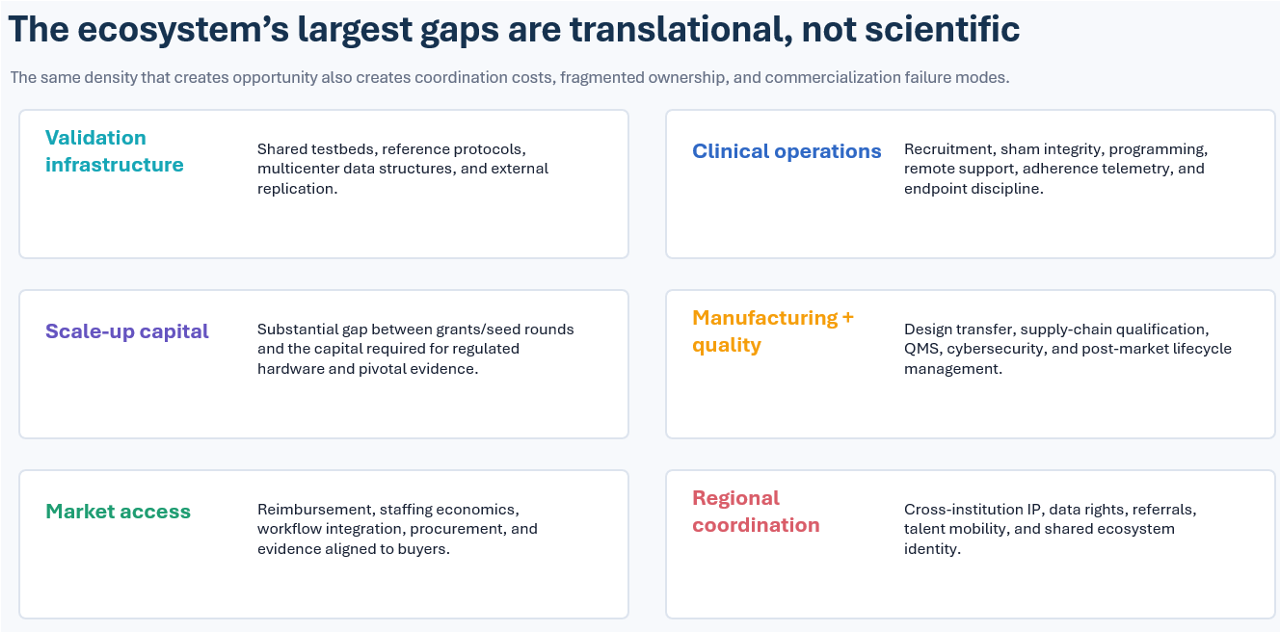
Figure 29. Evidence-mapped gaps in the Greater New York neurotechnology ecosystem.
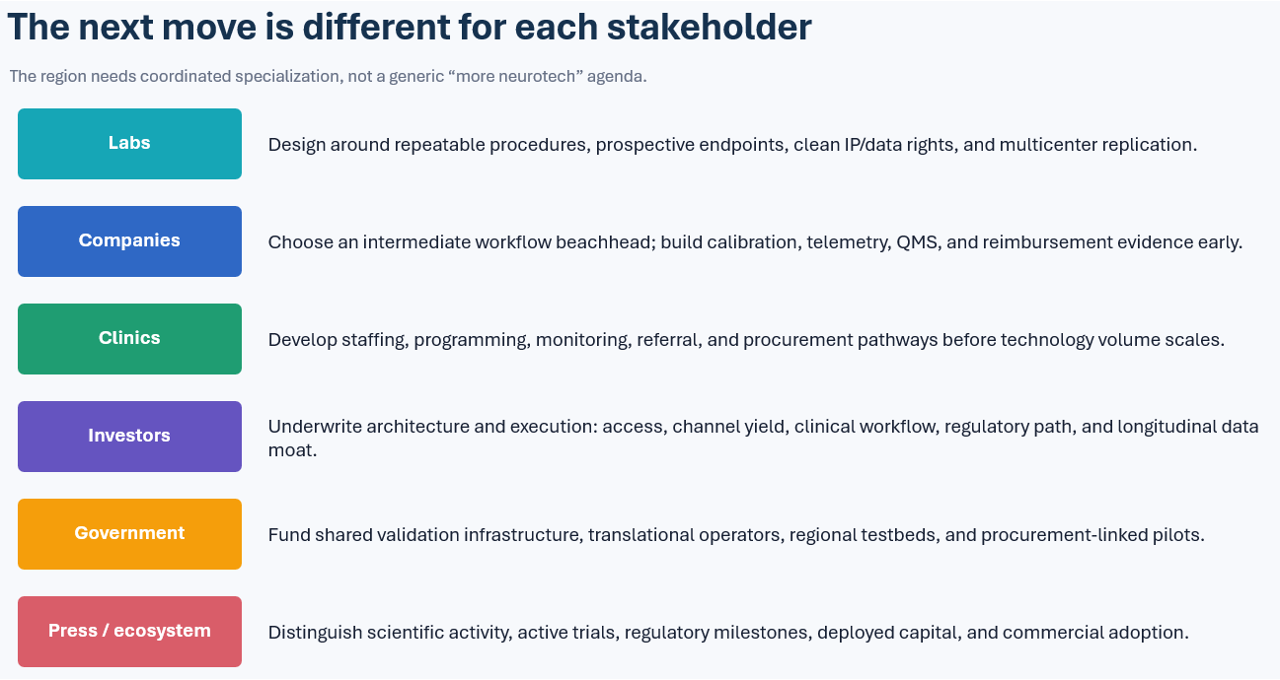
Figure 30. Priority actions for ecosystem stakeholders.